We could not find any results for:
Make sure your spelling is correct or try broadening your search.
| Share Name | Share Symbol | Market | Type |
|---|---|---|---|
| SouthState Corporation | NASDAQ:SSB | NASDAQ | Common Stock |
| Price Change | % Change | Share Price | Bid Price | Offer Price | High Price | Low Price | Open Price | Shares Traded | Last Trade | |
|---|---|---|---|---|---|---|---|---|---|---|
| 0.00 | 0.00% | 85.74 | 35.06 | 87.45 | 0 | 01:00:00 |
UNITED STATES
SECURITIES AND EXCHANGE COMMISSION
WASHINGTON, D.C. 20549
FORM
CURRENT REPORT
Pursuant to Section 13 or 15(d) of the Securities Exchange Act of 1934
Date of Report (Date of earliest event reported):

(Exact name of registrant as specified in its charter)
(State or Other Jurisdiction of Incorporation) | (Commission File Number) | (IRS Employer Identification No.) |
(Address of principal executive offices) | (Zip Code) |
(
(Registrant’s telephone number, including area code)
Not Applicable
(Former name or former address, if changed since last report)
Check the appropriate box below if the Form 8-K filing is intended to simultaneously satisfy the filing obligation of the registrant under any of the following provisions (see General Instruction A.2. below):
Securities registered pursuant to Section 12(b) of the Act:
Title of each class | Trading Symbol(s) | Name of each exchange on which registered |
Indicate by check mark whether the registrant is an emerging growth company as defined in Rule 405 of the Securities Act of 1933 (§230.405 of this chapter) or Rule 12b-2 of the Securities Exchange Act of 1934 (§240.12b-2 of this chapter).
Emerging growth company
If an emerging growth company, indicate by check mark if the registrant has elected not to use the extended transition period for complying with any new or revised financial accounting standards provided pursuant to Section 13(a) of the Exchange Act. ☐
Item 2.02 | Results of Operations and Financial Condition. |
On January 25, 2024, SouthState Corporation (“SouthState” or the “Company”) issued a press release announcing its financial results for the three- and twelve-month periods ended December 31, 2023, along with certain other financial information. Copies of the Company’s press release and presentation are attached as Exhibit 99.1 and 99.2, respectively, to this report and incorporated herein by reference.
SouthState will host a conference call on January 26, 2023 at 9 a.m. (ET) to discuss the Company’s fourth quarter 2023 results. Investors may call in (toll free) by dialing (888) 350-3899 within the U.S. and (646) 960-0343 for all other locations (passcode 4200408; host: Will Matthews, CFO). The numbers for international participants are listed at https://events.q4irportal.com/custom/access/2324/. Participants may also pre-register for the conference by navigating to https://events.q4inc.com/attendee/979545090. Access detail will be provided via email upon completion of registration.
Item 7.01 | Regulation FD Disclosure. | |||||
On January 25, 2024, the Company also made available the presentation (“Presentation”) prepared for use with the press release during the earnings conference call on January 26, 2024. Attached hereto and incorporated herein as Exhibit 99.2 is the text of that presentation.
The information contained in this Item 7.01 of this Current Report, including the information set forth in the Presentation filed as Exhibit 99.2 to, and incorporated in, this Current Report, is being "furnished" and shall not be deemed to be “filed” for purposes of Section 18 of the Exchange Act, or otherwise subject to the liability of that section, and shall not be incorporated by reference into any registration statement or other document filed under the Securities Act or the Exchange Act, except as shall be expressly set forth by specific reference in such filing.
Item 8.01 | Other Events. |
Firth Quarter 2024 Shareholder Dividend
The Board of Directors of the Company declared a quarterly cash dividend on its common stock of $0.52 per share, payable on February 16, 2024 to shareholders of record as of February 9, 2024.
Item 9.01 | Financial Statements and Exhibits. | |||
(d) | Exhibits: | |||
Exhibit No. | Description | |||
Exhibit 104 | Cover Page Interactive Data File (embedded within the Inline XBRL document) | |||
Cautionary Statement Regarding Forward Looking Statements
Statements included in this communication, which are not historical in nature are intended to be, and are hereby identified as, forward-looking statements for purposes of the safe harbor provided by Section 27A of the Securities Act of 1933 and Section 21E of the Securities Exchange Act of 1934. Forward-looking statements are based on, among other things, management’s beliefs, assumptions, current expectations, estimates and projections about the financial services industry, the economy and SouthState. Words and phrases such as “may,” “approximately,” “continue,” “should,” “expects,” “projects,” “anticipates,” “is likely,” “look ahead,” “look forward,” “believes,” “will,” “intends,” “estimates,” “strategy,”
2
“plan,” “could,” “potential,” “possible” and variations of such words and similar expressions are intended to identify such forward-looking statements.
SouthState cautions readers that forward-looking statements are subject to certain risks, uncertainties and assumptions that are difficult to predict with regard to, among other things, timing, extent, likelihood and degree of occurrence, which could cause actual results to differ materially from anticipated results. Such risks, uncertainties and assumptions, include, among others, the following: (1) economic downturn risk, potentially resulting in deterioration in the credit markets, inflation, greater than expected noninterest expenses, excessive loan losses and other negative consequences, which risks could be exacerbated by potential negative economic developments resulting from federal spending cuts and/or one or more federal budget-related impasses or actions; (2) interest rate risk primarily resulting from the interest rate environment, the number and pace of interest rate increases, and their impact on the Bank’s earnings, including from the correspondent and mortgage divisions, housing demand, the market value of the Bank’s loan and securities portfolios, and the market value of SouthState’s equity; (3) volatility in the financial services industry (including failures or rumors of failures of other depository institutions), along with actions taken by governmental agencies to address such turmoil, could affect the ability of depository institutions, including us, to attract and retain depositors and to borrow or raise capital; (4) the impact of increasing digitization of the banking industry and movement of customers to on-line platforms, and the possible impact on the Bank’s results of operations, customer base, expenses, suppliers and operations; (5) controls and procedures risk, including the potential failure or circumvention of our controls and procedures or failure to comply with regulations related to controls and procedures; (6) potential deterioration in real estate values; (7) the impact of competition with other financial institutions, including deposit and loan pricing pressures and the resulting impact, including as a result of compression to net interest margin; (8) risks relating to the ability to retain our culture and attract and retain qualified people, which could be exacerbated by the continuing work from remote environment; (9) credit risks associated with an obligor’s failure to meet the terms of any contract with the Bank or otherwise fail to perform as agreed under the terms of any loan-related document; (10) risks related to the ability of the Company to pursue its strategic plans which depend upon certain growth goals in our lines of business; (11) liquidity risk affecting the Bank’s ability to meet its obligations when they come due; (12) risks associated with an anticipated increase in SouthState’s investment securities portfolio, including risks associated with acquiring and holding investment securities or potentially determining that the amount of investment securities SouthState desires to acquire are not available on terms acceptable to SouthState; (13) unexpected outflows of uninsured deposits may require us to sell investment securities at a loss; (14) the loss of value of our investment portfolio could negatively impact market perceptions of us and could lead to deposit withdrawals; (15) price risk focusing on changes in market factors that may affect the value of traded instruments in “mark-to-market” portfolios; (16) transaction risk arising from problems with service or product delivery; (17) compliance risk involving risk to earnings or capital resulting from violations of or nonconformance with laws, rules, regulations, prescribed practices, or ethical standards; (18) regulatory change risk resulting from new laws, rules, regulations, accounting principles, proscribed practices or ethical standards, including, without limitation, the possibility that regulatory agencies may require higher levels of capital above the current regulatory-mandated minimums and including the impact of special FDIC assessments, the Consumer Financial Protection Bureau regulations or other guidance, and the possibility of changes in accounting standards, policies, principles and practices; (19) strategic risk resulting from adverse business decisions or improper implementation of business decisions; (20) reputation risk that adversely affects earnings or capital arising from negative public opinion including the effects of social media on market perceptions of us and banks generally; (21) cybersecurity risk related to the dependence of SouthState on internal computer systems and the technology of outside service providers, as well as the potential impacts of internal or external security breaches, which may subject the Company to potential business disruptions or financial losses resulting from deliberate attacks or unintentional events; (22) reputational and operational risks associated with environment, social and governance (ESG) matters, including the impact of recently passed state legislation and proposed federal and state regulatory guidance and regulation relating to climate change; (23) greater than expected noninterest expenses; (24) excessive loan losses; (25) reputational risk and possible higher than estimated reduced revenue from previously announced changes in the Bank’s consumer overdraft programs and other deposit products; (26) the risks of fluctuations in market prices for SouthState common stock that may or may not reflect economic condition or performance of SouthState; (27) the payment of dividends on SouthState common stock, which is subject to legal and regulatory limitations as well as the discretion of the board of directors of SouthState, SouthState’s performance and other factors; (28) ownership dilution risk associated with potential acquisitions in which SouthState’s stock may be issued as consideration for an acquired company; (29) operational, technological, cultural, regulatory, legal, credit and other risks associated with the exploration, consummation and integration of potential future acquisitions, whether involving stock or cash consideration; (30) catastrophic events such as hurricanes, tornados, earthquakes, floods or other natural or human
3
disasters, including public health crises and infectious disease outbreaks, as well as any government actions in response to such events, and the related disruption to local, regional and global economic activity and financial markets, and the impact that any of the foregoing may have on SouthState and its customers and other constituencies; (31) geopolitical risk from terrorist activities and armed conflicts that may result in economic and supply disruptions, and loss of market and consumer confidence; and (32) other factors that may affect future results of SouthState, as disclosed in SouthState’s Annual Report on Form 10-K, Quarterly Reports on Form 10-Q, and Current Reports on Form 8-K, filed by SouthState with the U.S. Securities and Exchange Commission (“SEC”) and available on the SEC’s website at http://www.sec.gov, any of which could cause actual results to differ materially from future results expressed, implied or otherwise anticipated by such forward-looking statements.
All forward-looking statements speak only as of the date they are made and are based on information available at that time. SouthState does not undertake any obligation to update or otherwise revise any forward-looking statements, whether as a result of new information, future events, or otherwise, except as required by federal securities laws. As forward-looking statements involve significant risks and uncertainties, caution should be exercised against placing undue reliance on such statements..
4
SIGNATURES
Pursuant to the requirements of the Securities Exchange Act of 1934, the registrant has duly caused this report to be signed on its behalf by the undersigned hereunto duly authorized.
SOUTHSTATE CORPORATION | ||
(Registrant) | ||
By: | /s/ William E. Matthews, V | |
Dated: January 25, 2024
5
Exhibit 99.1

SouthState Corporation Reports Fourth Quarter 2023 Results Declares Quarterly Cash Dividend | For Immediate Release | |
Media Contact | ||
Jackie Smith, 803.231.3486 | ||
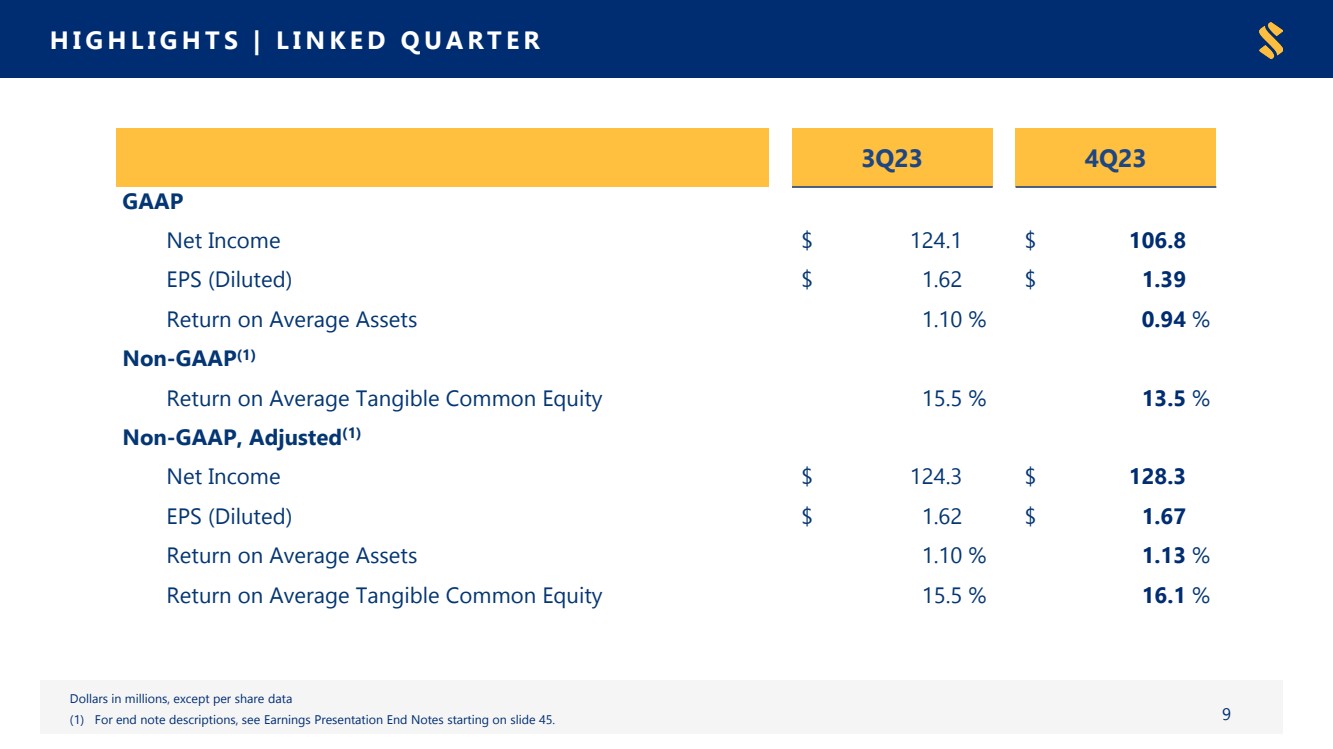
WINTER HAVEN, FL – January 25, 2024 – SouthState Corporation (NYSE: SSB) today released its unaudited results of operations and other financial information for the three-month and twelve-month periods ended December 31, 2023.
“We ended a year that demonstrated the resilience of the SouthState deposit franchise in the face of unprecedented change. In addition, loans grew 7% and we materially built our reserve", commented John C. Corbett, SouthState’s Chief Executive Officer. "While we remain cautious of the lag effects of the recent rate increases, we see tremendous opportunity coming out of the cycle. Since the pandemic, Florida has grown by over one million people and SouthState benefits from operating in 4 of the 5 fastest growing states in the country. We are in a great position to deliver outsized results for our shareholders, and I want to thank our team for their hard work and service to our clients during 2023."
Highlights of the fourth quarter of 2023 include:
Returns
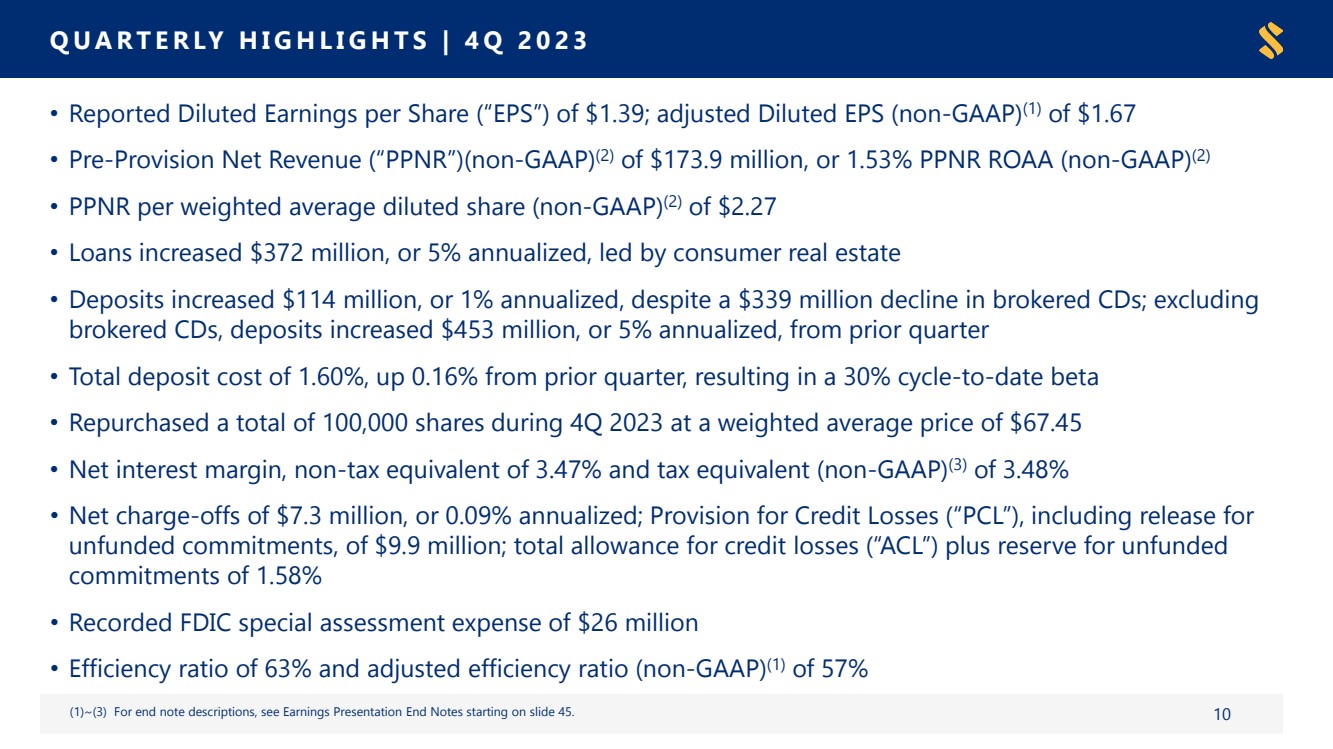
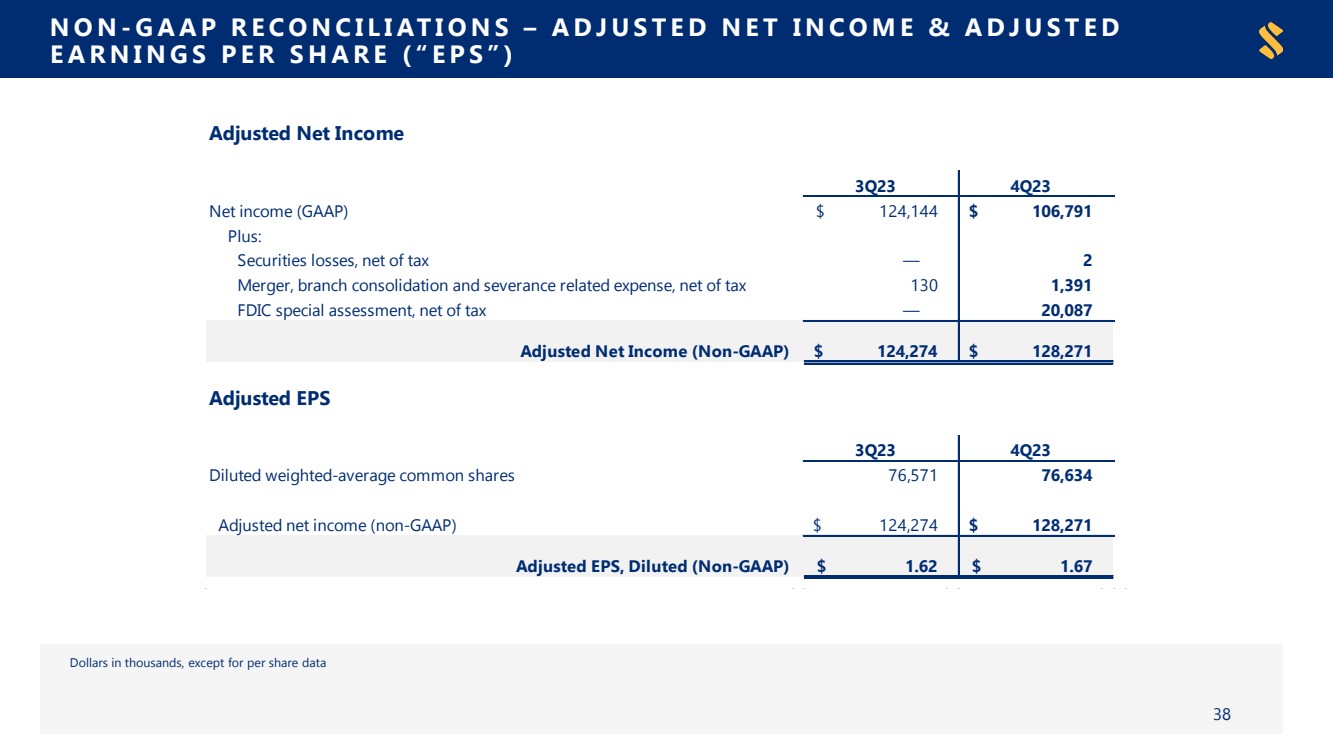
| ● | Reported Diluted Earnings per Share (“EPS”) of $1.39; Adjusted Diluted EPS (Non-GAAP) of $1.67 |
| ● | Net Income of $106.8 million; Adjusted Net Income (Non-GAAP) of $128.3 million |
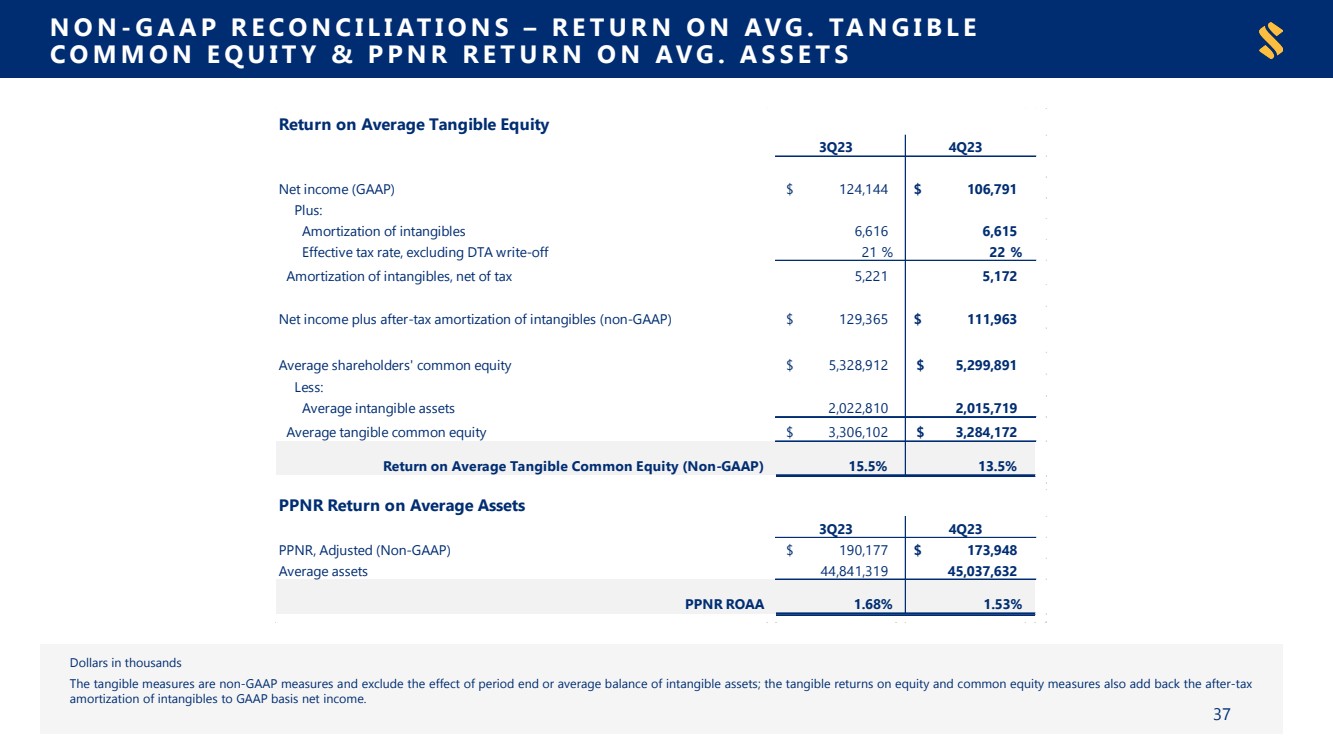
| ● | Return on Average Common Equity of 8.0%; Return on Average Tangible Common Equity (Non-GAAP) of 13.5% and Adjusted Return on Average Tangible Common Equity (Non-GAAP) of 16.1%* |
| ● | Return on Average Assets (“ROAA”) of 0.94% and Adjusted ROAA (Non-GAAP) of 1.13%* |
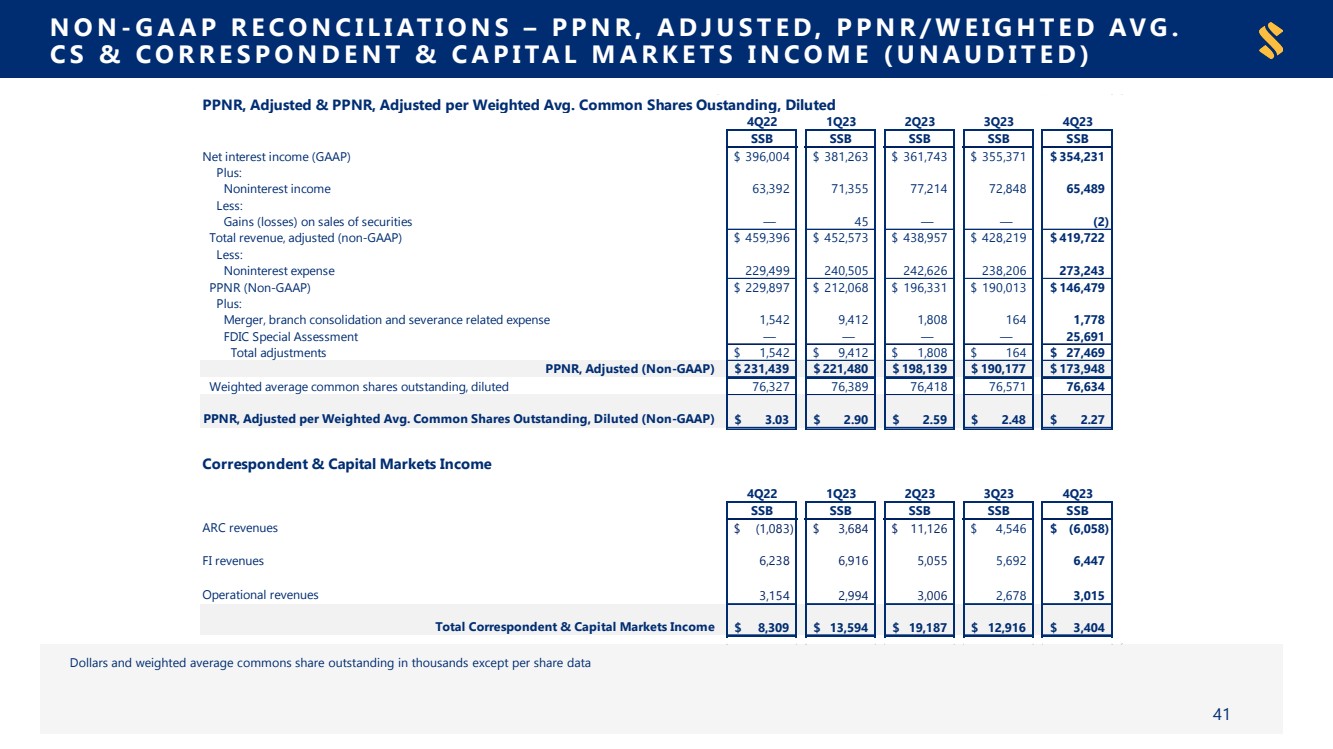
| ● | Pre-Provision Net Revenue (“PPNR”) per Weighted Average Diluted Share (Non-GAAP) of $2.27 |
| ● | Book Value per Share of $72.78; Tangible Book Value (“TBV”) per Share (Non-GAAP) of $46.32 |
Performance
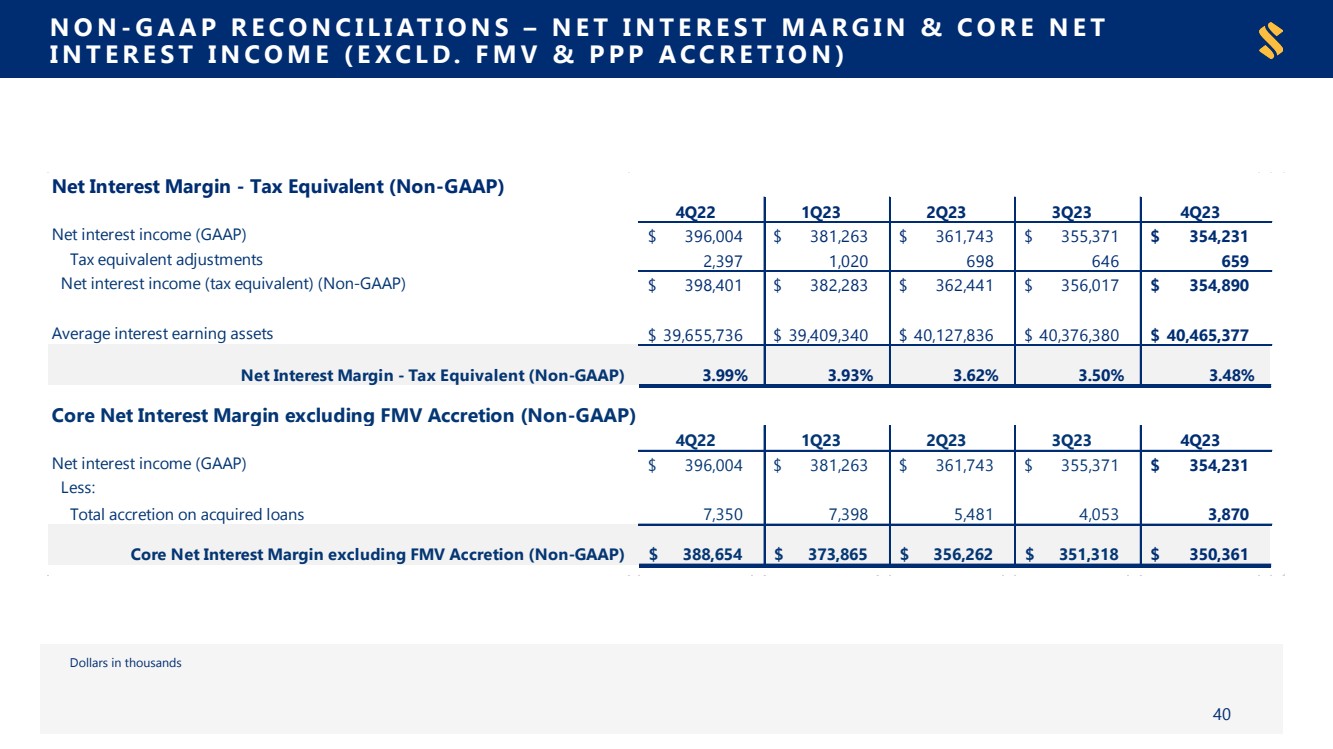
| ● | Net Interest Income of $354 million; Core Net Interest Income (excluding loan accretion) (Non-GAAP) of $350 million |
| ● | Net Interest Margin (“NIM”), non-tax equivalent of 3.47% and tax equivalent (Non-GAAP) of 3.48% |
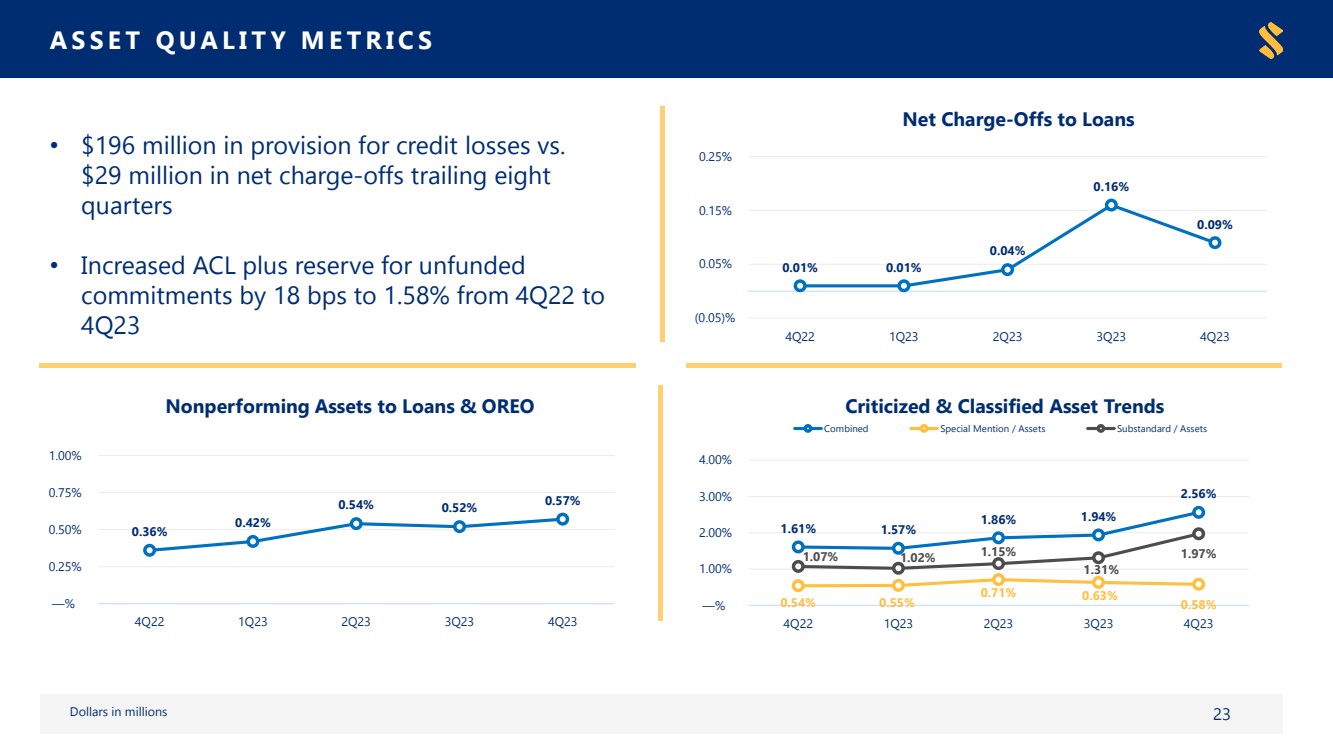
| ● | Net charge-offs of $7.3 million, or 0.09% annualized; $9.9 million Provision for Credit Losses (“PCL”), including release for unfunded commitments; total allowance for credit losses (“ACL”) plus reserve for unfunded commitments of 1.58%; year-to-date net charge-offs of $24.9 million, or 0.08% |
| ● | Noninterest Income of $65 million, down $7 million compared to the prior quarter, primarily due to a decrease in correspondent banking and capital markets income; Noninterest Income represented 0.58% of average assets for the fourth quarter of 2023 |
| ● | Recorded FDIC special assessment expense of $26 million |
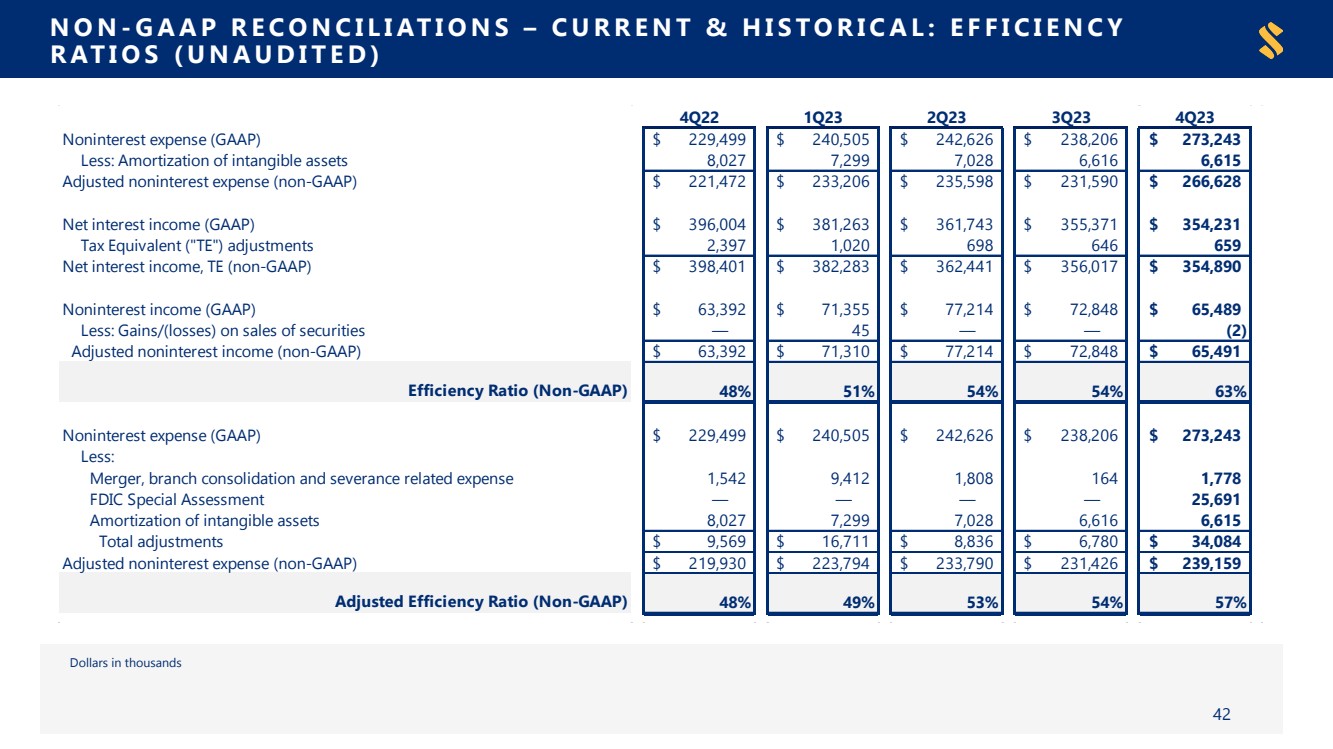
| ● | Efficiency Ratio of 63% and Adjusted Efficiency Ratio (Non-GAAP) of 57% |
Balance Sheet
| ● | Loans increased $372 million, or 5% annualized, led by consumer real estate; ending loan to deposit ratio of 87% |
| ● | Deposits increased $114 million, or 1% annualized, despite a $339 million decline in brokered CDs; excluding brokered CDs, deposits increased $453 million, or 5% annualized, from prior quarter |
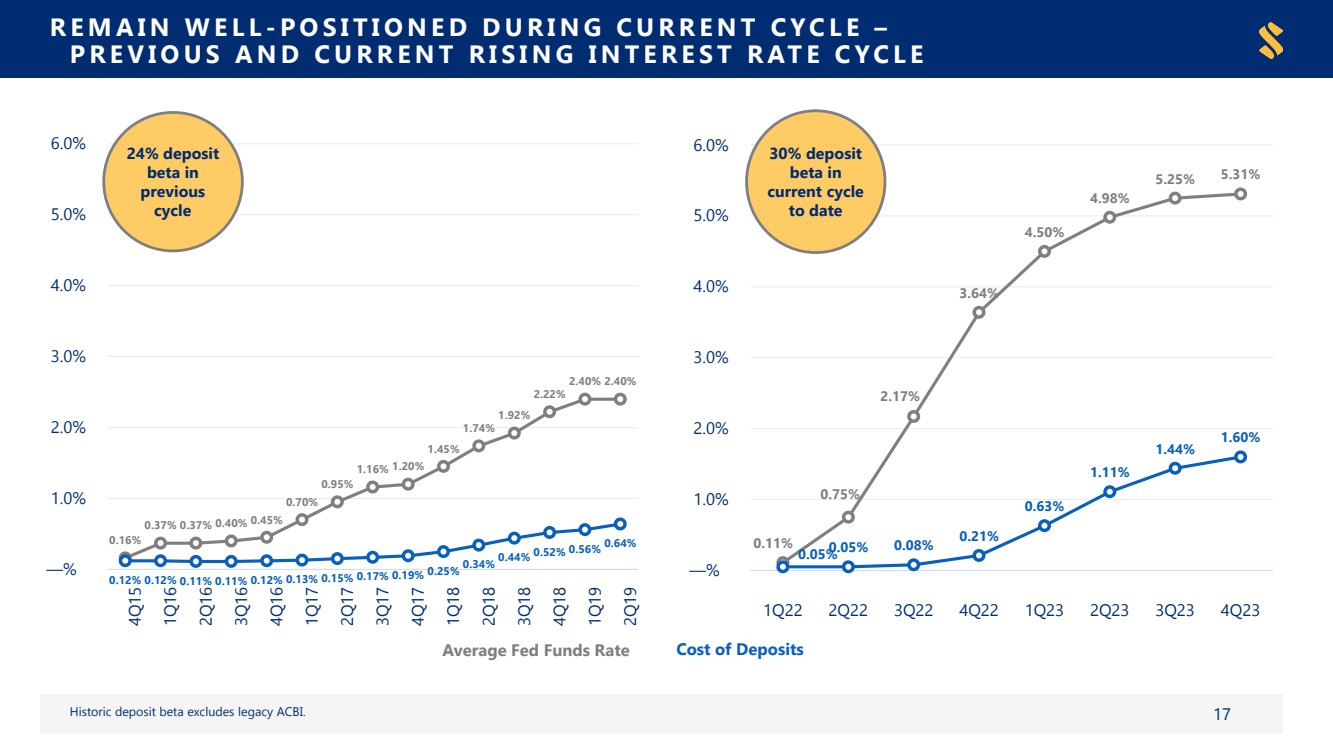
| ● | Total deposit cost of 1.60%, up 0.16% from prior quarter, resulting in a 30% cycle-to-date beta |
| ● | Repurchased a total of 100,000 shares during 4Q 2023 at a weighted average price of $67.45 |
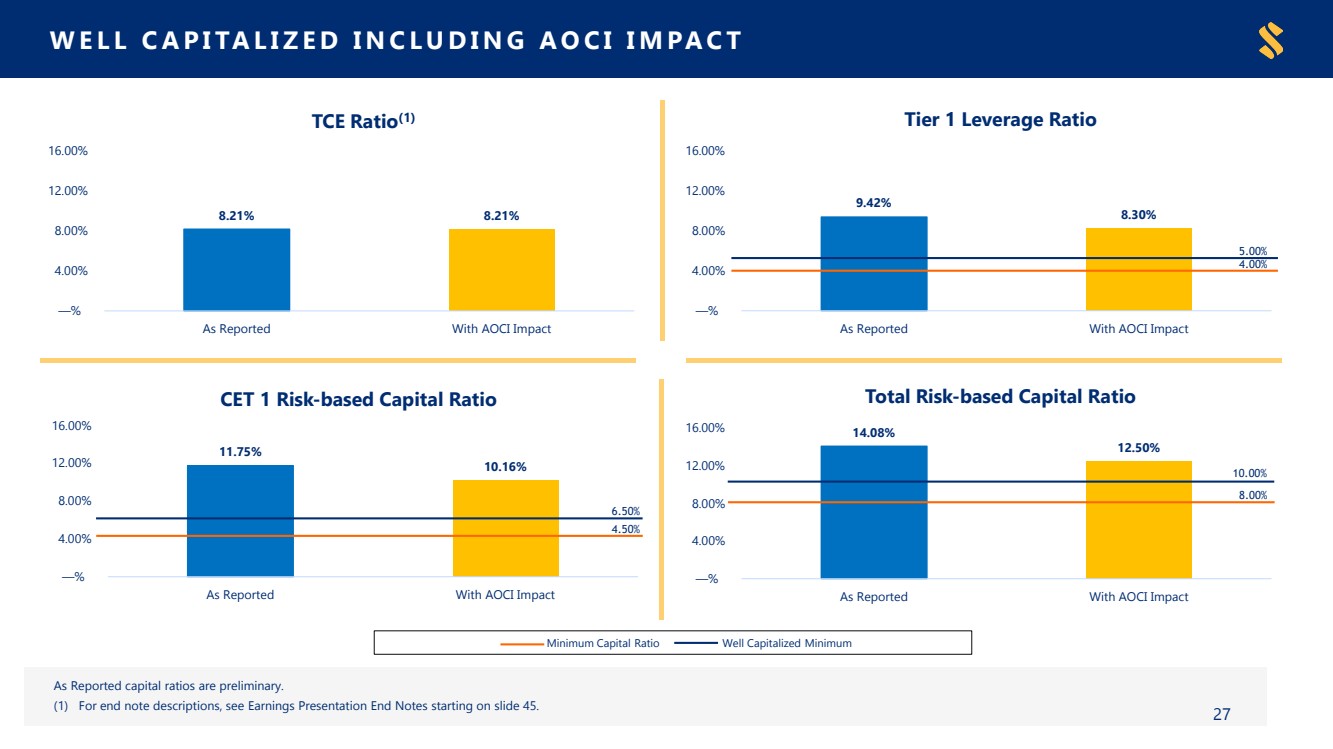
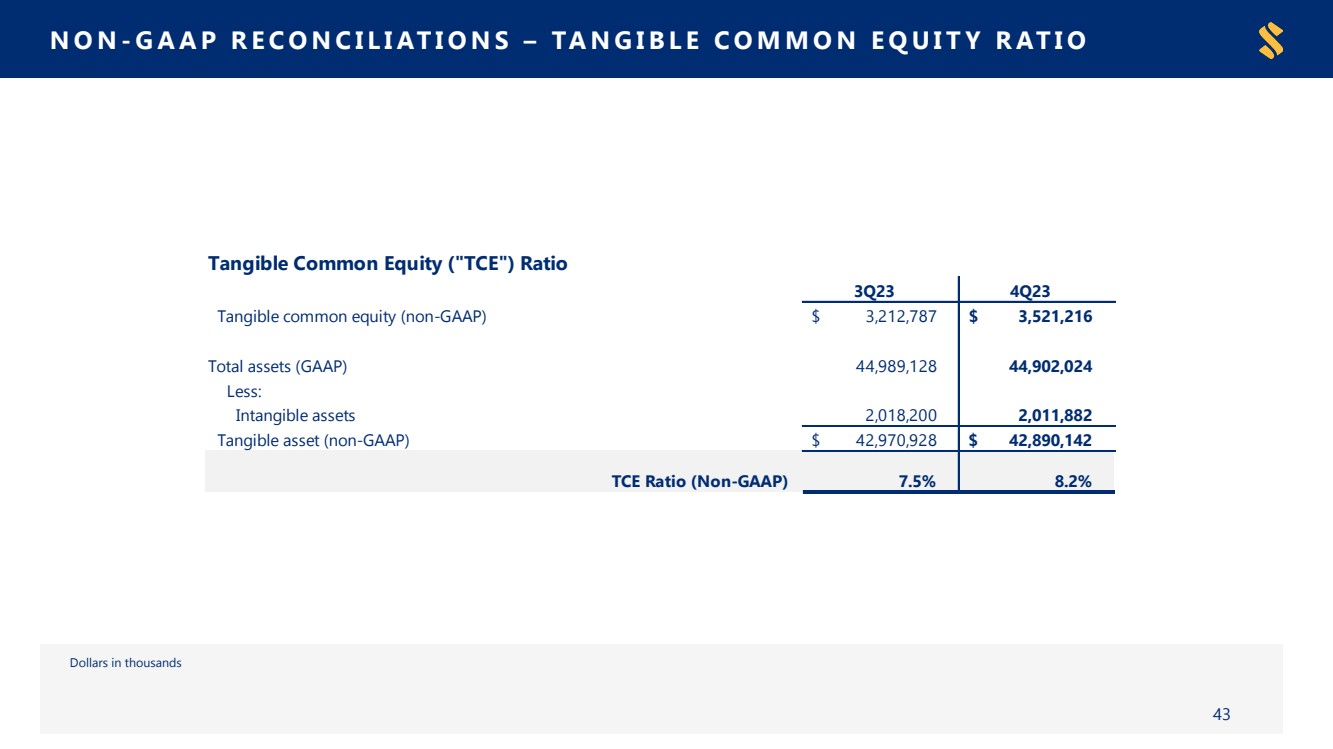
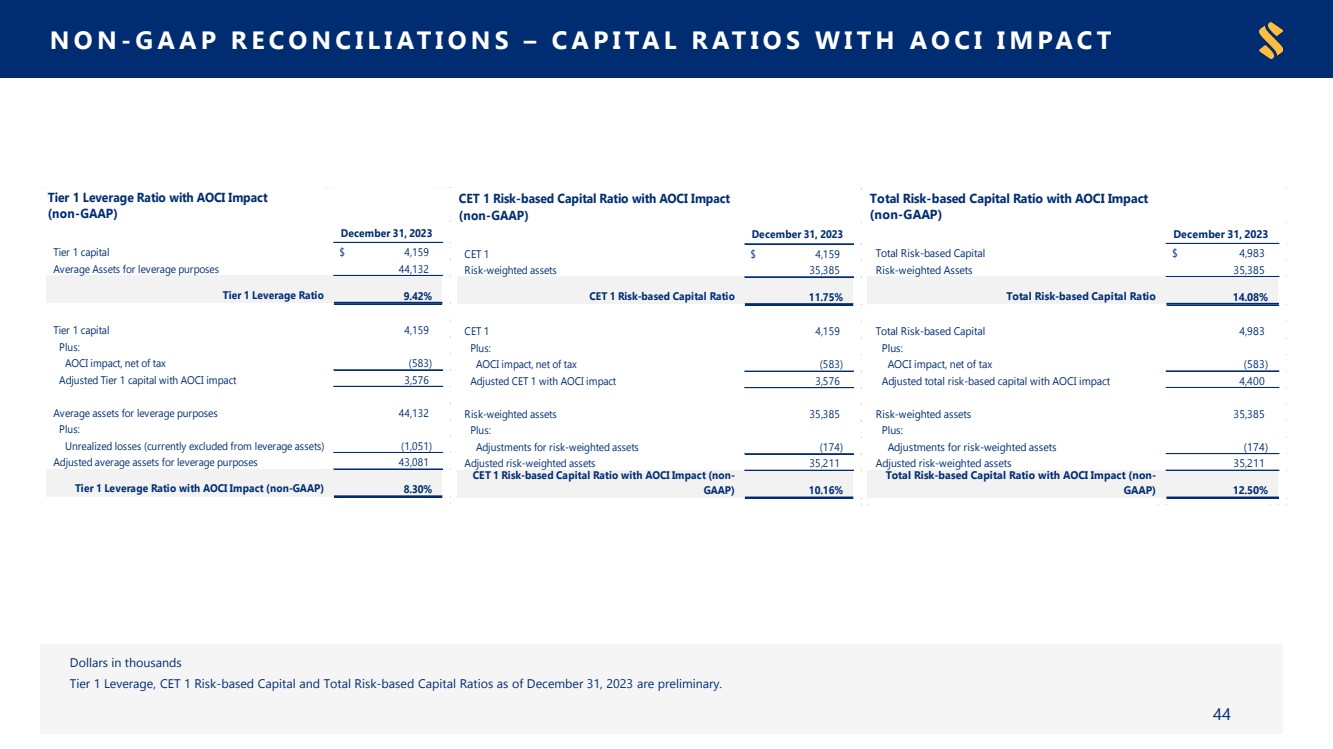
| ● | Strong capital position with Tangible Common Equity, Total Risk-Based Capital, Tier 1 Leverage, and Tier 1 Common Equity ratios of 8.2%, 14.1%, 9.4%, and 11.8%, respectively† |
Subsequent Events
| ● | The Board of Directors of the Company declared a quarterly cash dividend on its common stock of $0.52 per share, payable on February 16, 2024 to shareholders of record as of February 9, 2024 |
∗ Annualized percentages
† Preliminary
Financial Performance
| | Three Months Ended | | Twelve Months Ended | | |||||||||||||||||
(Dollars in thousands, except per share data) | | Dec. 31, | | Sep. 30, | | Jun. 30, | | Mar. 31, | | Dec. 31, | | Dec. 31, | | Dec. 31, | | |||||||
INCOME STATEMENT | | 2023 | | 2023 | | 2023 | | 2023 | | 2022 | | 2023 | | 2022 | | |||||||
Interest Income | | | | | | | | | | | | | | | | | | | | | | |
Loans, including fees (1) | | $ | 459,880 | | $ | 443,805 | | $ | 419,355 | | $ | 393,366 | | $ | 359,552 | | $ | 1,716,405 | | $ | 1,178,026 | |
Investment securities, trading securities, federal funds sold and securities | | | | | | | | | | | | | | | | | | | | | | |
purchased under agreements to resell | | | 55,555 | | | 56,704 | | | 58,698 | | | 57,043 | | | 64,337 | | | 228,001 | | | 218,999 | |
Total interest income | | | 515,435 | | | 500,509 | | | 478,053 | | | 450,409 | | | 423,889 | | | 1,944,406 | | | 1,397,025 | |
Interest Expense | | | | | | | | | | | | | | | | | | | | | | |
Deposits | | | 149,584 | | | 133,944 | | | 100,787 | | | 55,942 | | | 19,945 | | | 440,257 | | | 36,984 | |
Federal funds purchased, securities sold under agreements | | | | | | | | | | | | | | | | | | | | | | |
to repurchase, and other borrowings | | | 11,620 | | | 11,194 | | | 15,523 | | | 13,204 | | | 7,940 | | | 51,541 | | | 24,370 | |
Total interest expense | | | 161,204 | | | 145,138 | | | 116,310 | | | 69,146 | | | 27,885 | | | 491,798 | | | 61,354 | |
Net Interest Income | | | 354,231 | | | 355,371 | | | 361,743 | | | 381,263 | | | 396,004 | | | 1,452,608 | | | 1,335,671 | |
Provision for credit losses | | | 9,893 | | | 32,709 | | | 38,389 | | | 33,091 | | | 47,142 | | | 114,082 | | | 81,855 | |
Net Interest Income after Provision for Credit Losses | | | 344,338 | | | 322,662 | | | 323,354 | | | 348,172 | | | 348,862 | | | 1,338,526 | | | 1,253,816 | |
Noninterest Income | | | 65,489 | | | 72,848 | | | 77,214 | | | 71,355 | | | 63,392 | | | 286,906 | | | 309,247 | |
Noninterest Expense | | | | | | | | | | | | | | | | | | | | | | |
Operating expense | | | 245,774 | | | 238,042 | | | 240,818 | | | 231,093 | | | 227,957 | | | 955,727 | | | 898,813 | |
Merger, branch consolidation and severance related expense | | | 1,778 | | | 164 | | | 1,808 | | | 9,412 | | | 1,542 | | | 13,162 | | | 30,888 | |
FDIC special assessment | | | 25,691 | | | — | | | — | | | — | | | — | | | 25,691 | | | — | |
Total noninterest expense | | | 273,243 | | | 238,206 | | | 242,626 | | | 240,505 | | | 229,499 | | | 994,580 | | | 929,701 | |
Income before Income Taxes Provision | | | 136,584 | | | 157,304 | | | 157,942 | | | 179,022 | | | 182,755 | | | 630,852 | | | 633,362 | |
Income taxes provision | | | 29,793 | | | 33,160 | | | 34,495 | | | 39,096 | | | 39,253 | | | 136,544 | | | 137,313 | |
Net Income | | $ | 106,791 | | $ | 124,144 | | $ | 123,447 | | $ | 139,926 | | $ | 143,502 | | $ | 494,308 | | $ | 496,049 | |
| | | | | | | | | | | | | | | | | | | | | | |
Adjusted Net Income (non-GAAP) (2) | | | | | | | | | | | | | | | | | | | | | | |
Net Income (GAAP) | | $ | 106,791 | | $ | 124,144 | | $ | 123,447 | | $ | 139,926 | | $ | 143,502 | | $ | 494,308 | | $ | 496,049 | |
Securities losses (gains), net of tax | | | 2 | | | — | | | — | | | (35) | | | — | | | (33) | | | (24) | |
Initial provision for credit losses - NonPCD loans and UFC from ACBI, net of tax | | | — | | | — | | | — | | | — | | | — | | | — | | | 13,492 | |
Merger, branch consolidation and severance related expense, net of tax | | | 1,391 | | | 130 | | | 1,414 | | | 7,356 | | | 1,211 | | | 10,291 | | | 24,163 | |
FDIC special assessment, net of tax | | | 20,087 | | | — | | | — | | | — | | | — | | | 20,087 | | | — | |
Adjusted Net Income (non-GAAP) | | $ | 128,271 | | $ | 124,274 | | $ | 124,861 | | $ | 147,247 | | $ | 144,713 | | $ | 524,653 | | $ | 533,680 | |
| | | | | | | | | | | | | | | | | | | | | | |
Basic earnings per common share | | $ | 1.40 | | $ | 1.63 | | $ | 1.62 | | $ | 1.84 | | $ | 1.90 | | $ | 6.50 | | $ | 6.65 | |
Diluted earnings per common share | | $ | 1.39 | | $ | 1.62 | | $ | 1.62 | | $ | 1.83 | | $ | 1.88 | | $ | 6.46 | | $ | 6.60 | |
Adjusted net income per common share - Basic (non-GAAP) (2) | | $ | 1.69 | | $ | 1.63 | | $ | 1.64 | | $ | 1.94 | | $ | 1.91 | | $ | 6.90 | | $ | 7.16 | |
Adjusted net income per common share - Diluted (non-GAAP) (2) | | $ | 1.67 | | $ | 1.62 | | $ | 1.63 | | $ | 1.93 | | $ | 1.90 | | $ | 6.86 | | $ | 7.10 | |
Dividends per common share | | $ | 0.52 | | $ | 0.52 | | $ | 0.50 | | $ | 0.50 | | $ | 0.50 | | $ | 2.04 | | $ | 1.98 | |
Basic weighted-average common shares outstanding | | | 76,100,187 | | | 76,139,170 | | | 76,057,977 | | | 75,902,440 | | | 75,639,640 | | | 76,050,730 | | | 74,550,708 | |
Diluted weighted-average common shares outstanding | | | 76,634,100 | | | 76,571,430 | | | 76,417,537 | | | 76,388,954 | | | 76,326,777 | | | 76,479,557 | | | 75,181,305 | |
Effective tax rate | | | 21.81% | | | 21.08% | | | 21.84% | | | 21.84% | | | 21.48% | | | 21.64% | | | 21.68% | |
2
Performance and Capital Ratios
| | Three Months Ended | | Twelve Months Ended | | | |||||||||||||||
| | Dec. 31, | | Sep. 30, | | Jun. 30, | | Mar. 31, | | Dec. 31, | | Dec. 31, | | Dec. 31, | | | |||||
| | 2023 | | 2023 | | 2023 | | 2023 | | 2022 | | 2023 | | 2022 | | | |||||
PERFORMANCE RATIOS | | | | | | | | | | | | | | | | | | | | | |
Return on average assets (annualized) | | | 0.94 | % | | 1.10 | % | | 1.11 | % | | 1.29 | % | | 1.28 | % | 1.11 | % | 1.12 | % | |
Adjusted return on average assets (annualized) (non-GAAP) (2) | | | 1.13 | % | | 1.10 | % | | 1.12 | % | | 1.35 | % | | 1.29 | % | 1.17 | % | 1.20 | % | |
Return on average common equity (annualized) | | | 7.99 | % | | 9.24 | % | | 9.34 | % | | 10.96 | % | | 11.41 | % | 9.37 | % | 9.84 | % | |
Adjusted return on average common equity (annualized) (non-GAAP) (2) | | | 9.60 | % | | 9.25 | % | | 9.45 | % | | 11.53 | % | | 11.50 | % | 9.94 | % | 10.59 | % | |
Return on average tangible common equity (annualized) (non-GAAP) (3) | | | 13.53 | % | | 15.52 | % | | 15.81 | % | | 18.81 | % | | 20.17 | % | 15.87 | % | 17.16 | % | |
Adjusted return on average tangible common equity (annualized) (non-GAAP) (2) (3) | | | 16.12 | % | | 15.54 | % | | 15.98 | % | | 19.75 | % | | 20.33 | % | 16.80 | % | 18.40 | % | |
Efficiency ratio (tax equivalent) | | | 63.43 | % | | 54.00 | % | | 53.59 | % | | 51.41 | % | | 47.96 | % | 55.50 | % | 54.21 | % | |
Adjusted efficiency ratio (non-GAAP) (4) | | | 56.89 | % | | 53.96 | % | | 53.18 | % | | 49.34 | % | | 47.63 | % | 53.27 | % | 52.34 | % | |
Dividend payout ratio (5) | | | 37.01 | % | | 31.84 | % | | 30.75 | % | | 27.09 | % | | 26.40 | % | 31.34 | % | 29.54 | % | |
Book value per common share | | $ | 72.78 | | $ | 68.81 | | $ | 69.61 | | $ | 69.19 | | $ | 67.04 | | | | | | |
Tangible book value per common share (non-GAAP) (3) | | $ | 46.32 | | $ | 42.26 | | $ | 42.96 | | $ | 42.40 | | $ | 40.09 | | | | | | |
| | | | | | | | | | | | | | | | | | | | | |
CAPITAL RATIOS | | | | | | | | | | | | | | | | | | | | | |
Equity-to-assets | | | 12.3 | % | | 11.6 | % | | 11.8 | % | | 11.7 | % | | 11.6 | % | | | | | |
Tangible equity-to-tangible assets (non-GAAP) (3) | | | 8.2 | % | | 7.5 | % | | 7.6 | % | | 7.5 | % | | 7.2 | % | | | | | |
Tier 1 leverage (6) | | | 9.4 | % | | 9.3 | % | | 9.2 | % | | 9.1 | % | | 8.7 | % | | | | | |
Tier 1 common equity (6) | | | 11.8 | % | | 11.5 | % | | 11.3 | % | | 11.1 | % | | 11.0 | % | | | | | |
Tier 1 risk-based capital (6) | | | 11.8 | % | | 11.5 | % | | 11.3 | % | | 11.1 | % | | 11.0 | % | | | | | |
Total risk-based capital (6) | | | 14.1 | % | | 13.8 | % | | 13.5 | % | | 13.3 | % | | 13.0 | % | | | | | |
3
Balance Sheet
| | Ending Balance | | |||||||||||||
(Dollars in thousands, except per share and share data) | | Dec. 31, | | Sep. 30, | | Jun. 30, | | Mar. 31, | | Dec. 31, | | |||||
BALANCE SHEET | | 2023 | | 2023 | | 2023 | | 2023 | | 2022 | | |||||
Assets | | | | | | | | | | | | | | | | |
Cash and due from banks | | $ | 510,922 | | $ | 514,917 | | $ | 552,900 | | $ | 558,158 | | $ | 548,387 | |
Federal funds sold and interest-earning deposits with banks | | | 487,955 | | | 814,220 | | | 960,849 | | | 1,438,504 | | | 764,176 | |
Cash and cash equivalents | | | 998,877 | | | 1,329,137 | | | 1,513,749 | | | 1,996,662 | | | 1,312,563 | |
| | | | | | | | | | | | | | | | |
Trading securities, at fair value | | | 31,321 | | | 114,154 | | | 56,580 | | | 16,039 | | | 31,263 | |
Investment securities: | | | | | | | | | | | | | | | | |
Securities held to maturity | | | 2,487,440 | | | 2,533,713 | | | 2,585,155 | | | 2,636,673 | | | 2,683,241 | |
Securities available for sale, at fair value | | | 4,784,388 | | | 4,623,618 | | | 4,949,334 | | | 5,159,999 | | | 5,326,822 | |
Other investments | | | 192,043 | | | 187,152 | | | 196,728 | | | 217,991 | | | 179,717 | |
Total investment securities | | | 7,463,871 | | | 7,344,483 | | | 7,731,217 | | | 8,014,663 | | | 8,189,780 | |
Loans held for sale | | | 50,888 | | | 27,443 | | | 42,951 | | | 27,289 | | | 28,968 | |
Loans: | | | | | | | | | | | | | | | | |
Purchased credit deteriorated | | | 1,108,813 | | | 1,171,543 | | | 1,269,983 | | | 1,325,400 | | | 1,429,731 | |
Purchased non-credit deteriorated | | | 4,796,913 | | | 5,064,254 | | | 5,275,913 | | | 5,620,290 | | | 5,943,092 | |
Non-acquired | | | 26,482,763 | | | 25,780,875 | | | 24,990,889 | | | 23,750,452 | | | 22,805,039 | |
Less allowance for credit losses | | | (456,573) | | | (447,956) | | | (427,392) | | | (370,645) | | | (356,444) | |
Loans, net | | | 31,931,916 | | | 31,568,716 | | | 31,109,393 | | | 30,325,497 | | | 29,821,418 | |
Premises and equipment, net | | | 519,197 | | | 516,583 | | | 518,353 | | | 517,146 | | | 520,635 | |
Bank owned life insurance | | | 991,454 | | | 984,881 | | | 979,494 | | | 967,750 | | | 964,708 | |
Mortgage servicing rights | | | 85,164 | | | 89,476 | | | 87,539 | | | 85,406 | | | 86,610 | |
Core deposit and other intangibles | | | 88,776 | | | 95,094 | | | 102,256 | | | 109,603 | | | 116,450 | |
Goodwill | | | 1,923,106 | | | 1,923,106 | | | 1,923,106 | | | 1,923,106 | | | 1,923,106 | |
Other assets | | | 817,454 | | | 996,055 | | | 875,694 | | | 940,666 | | | 923,195 | |
Total assets | | $ | 44,902,024 | | $ | 44,989,128 | | $ | 44,940,332 | | $ | 44,923,827 | | $ | 43,918,696 | |
| | | | | | | | | | | | | | | | |
Liabilities and Shareholders' Equity | | | | | | | | | | | | | | | | |
Deposits: | | | | | | | | | | | | | | | | |
Noninterest-bearing | | $ | 10,649,274 | | $ | 11,158,431 | | $ | 11,489,483 | | $ | 12,422,583 | | $ | 13,168,656 | |
Interest-bearing | | | 26,399,635 | | | 25,776,767 | | | 25,252,395 | | | 23,979,009 | | | 23,181,967 | |
Total deposits | | | 37,048,909 | | | 36,935,198 | | | 36,741,878 | | | 36,401,592 | | | 36,350,623 | |
Federal funds purchased and securities | | | | | | | | | | | | | | | | |
sold under agreements to repurchase | | | 489,185 | | | 513,304 | | | 581,446 | | | 544,108 | | | 556,417 | |
Other borrowings | | | 491,904 | | | 391,997 | | | 792,090 | | | 1,292,182 | | | 392,275 | |
Reserve for unfunded commitments | | | 56,303 | | | 62,347 | | | 63,399 | | | 85,068 | | | 67,215 | |
Other liabilities | | | 1,282,625 | | | 1,855,295 | | | 1,471,509 | | | 1,351,873 | | | 1,477,239 | |
Total liabilities | | | 39,368,926 | | | 39,758,141 | | | 39,650,322 | | | 39,674,823 | | | 38,843,769 | |
| | | | | | | | | | | | | | | | |
Shareholders' equity: | | | | | | | | | | | | | | | | |
Common stock - $2.50 par value; authorized 160,000,000 shares | | | 190,055 | | | 190,043 | | | 189,990 | | | 189,649 | | | 189,261 | |
Surplus | | | 4,240,413 | | | 4,238,753 | | | 4,228,910 | | | 4,224,503 | | | 4,215,712 | |
Retained earnings | | | 1,685,166 | | | 1,618,080 | | | 1,533,508 | | | 1,448,636 | | | 1,347,042 | |
Accumulated other comprehensive loss | | | (582,536) | | | (815,889) | | | (662,398) | | | (613,784) | | | (677,088) | |
Total shareholders' equity | | | 5,533,098 | | | 5,230,987 | | | 5,290,010 | | | 5,249,004 | | | 5,074,927 | |
Total liabilities and shareholders' equity | | $ | 44,902,024 | | $ | 44,989,128 | | $ | 44,940,332 | | $ | 44,923,827 | | $ | 43,918,696 | |
| | | | | | | | | | | | | | | | |
Common shares issued and outstanding | | | 76,022,039 | | | 76,017,366 | | | 75,995,979 | | | 75,859,665 | | | 75,704,563 | |
4
Net Interest Income and Margin
| | Three Months Ended | | ||||||||||||||||||||||
| | Dec. 31, 2023 | | Sep. 30, 2023 | | Dec. 31, 2022 | | ||||||||||||||||||
(Dollars in thousands) | | Average | | Income/ | | Yield/ | | Average | | Income/ | | Yield/ | | Average | | Income/ | | Yield/ | | ||||||
YIELD ANALYSIS | | Balance | | Expense | | Rate | | Balance | | Expense | | Rate | | Balance | | Expense | | Rate | | ||||||
Interest-Earning Assets: | | | | | | | | | | | | | | | | | | | | | | | | | |
Federal funds sold and interest-earning deposits with banks | | $ | 814,244 | | $ | 10,029 | | 4.89% | | $ | 822,805 | | $ | 10,831 | | 5.22% | | $ | 1,849,877 | | $ | 16,491 | | 3.54% | |
Investment securities | | | 7,382,800 | | | 45,526 | | 2.45% | | | 7,714,079 | | | 45,873 | | 2.36% | | | 8,286,894 | | | 47,846 | | 2.29% | |
Loans held for sale | | | 28,878 | | | 552 | | 7.58% | | | 34,736 | | | 517 | | 5.90% | | | 25,633 | | | 401 | | 6.21% | |
Total loans, excluding PPP | | | 32,234,772 | | | 459,316 | | 5.65% | | | 31,799,469 | | | 443,275 | | 5.53% | | | 29,480,843 | | | 359,120 | | 4.83% | |
Total PPP loans | | | 4,683 | | | 12 | | 1.02% | | | 5,291 | | | 13 | | 0.97% | | | 12,489 | | | 31 | | 0.98% | |
Total loans held for investment | | | 32,239,455 | | | 459,328 | | 5.65% | | | 31,804,760 | | | 443,288 | | 5.53% | | | 29,493,332 | | | 359,151 | | 4.83% | |
Total interest-earning assets | | | 40,465,377 | | | 515,435 | | 5.05% | | | 40,376,380 | | | 500,509 | | 4.92% | | | 39,655,736 | | | 423,889 | | 4.24% | |
Noninterest-earning assets | | | 4,572,255 | | | | | | | | 4,464,939 | | | | | | | | 4,774,158 | | | | | | |
Total Assets | | $ | 45,037,632 | | | | | | | $ | 44,841,319 | | | | | | | $ | 44,429,894 | | | | | | |
| | | | | | | | | | | | | | | | | | | | | | | | | |
Interest-Bearing Liabilities ("IBL"): | | | | | | | | | | | | | | | | | | | | | | | | | |
Transaction and money market accounts | | $ | 18,957,647 | | $ | 107,994 | | 2.26% | | $ | 18,291,300 | | $ | 93,465 | | 2.03% | | $ | 17,044,865 | | $ | 16,901 | | 0.39% | |
Savings deposits | | | 2,680,065 | | | 1,888 | | 0.28% | | | 2,845,250 | | | 1,919 | | 0.27% | | | 3,536,330 | | | 1,021 | | 0.11% | |
Certificates and other time deposits | | | 4,294,555 | | | 39,702 | | 3.67% | | | 4,413,855 | | | 38,560 | | 3.47% | | | 2,444,361 | | | 2,023 | | 0.33% | |
Federal funds purchased | | | 256,672 | | | 3,453 | | 5.34% | | | 236,732 | | | 3,128 | | 5.24% | | | 186,232 | | | 1,694 | | 3.61% | |
Repurchase agreements | | | 265,839 | | | 1,458 | | 2.18% | | | 303,339 | | | 1,163 | | 1.52% | | | 363,336 | | | 253 | | 0.28% | |
Other borrowings | | | 438,701 | | | 6,709 | | 6.07% | | | 456,187 | | | 6,903 | | 6.00% | | | 435,806 | | | 5,993 | | 5.46% | |
Total interest-bearing liabilities | | | 26,893,479 | | | 161,204 | | 2.38% | | | 26,546,663 | | | 145,138 | | 2.17% | | | 24,010,930 | | | 27,885 | | 0.46% | |
Noninterest-bearing liabilities ("Non-IBL") | | | 12,844,262 | | | | | | | | 12,965,744 | | | | | | | | 15,427,380 | | | | | | |
Shareholders' equity | | | 5,299,891 | | | | | | | | 5,328,912 | | | | | | | | 4,991,584 | | | | | | |
Total Non-IBL and shareholders' equity | | | 18,144,153 | | | | | | | | 18,294,656 | | | | | | | | 20,418,964 | | | | | | |
Total Liabilities and Shareholders' Equity | | $ | 45,037,632 | | | | | | | $ | 44,841,319 | | | | | | | $ | 44,429,894 | | | | | | |
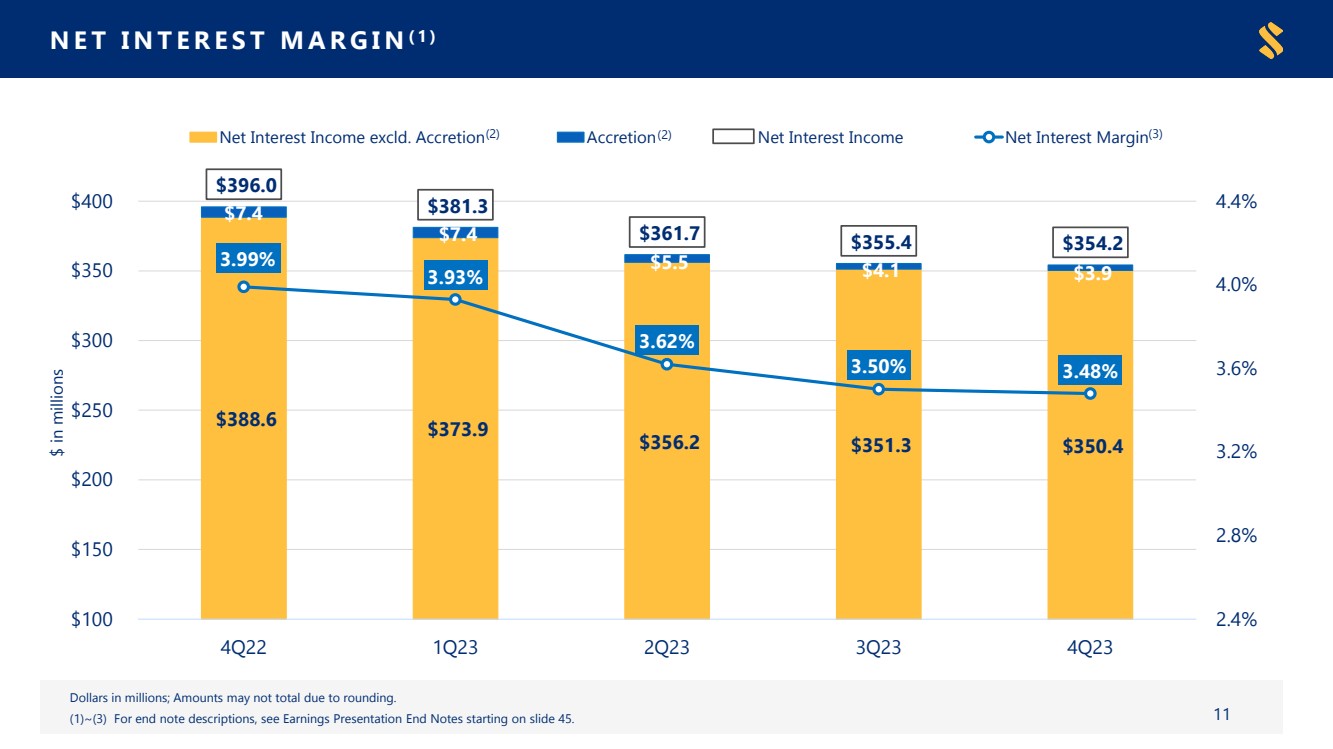
Net Interest Income and Margin (Non-Tax Equivalent) | | | | | $ | 354,231 | | 3.47% | | | | | $ | 355,371 | | 3.49% | | | | | $ | 396,004 | | 3.96% | |
Net Interest Margin (Tax Equivalent) (non-GAAP) | | | | | | | | 3.48% | | | | | | | | 3.50% | | | | | | | | 3.99% | |
Total Deposit Cost (without Debt and Other Borrowings) | | | | | | | | 1.60% | | | | | | | | 1.44% | | | | | | | | 0.21% | |
Overall Cost of Funds (including Demand Deposits) | | | | | | | | 1.69% | | | | | | | | 1.52% | | | | | | | | 0.29% | |
| | | | | | | | | | | | | | | | | | | | | | | | | |
Total Accretion on Acquired Loans (1) | | | | | $ | 3,870 | | | | | | | $ | 4,053 | | | | | | | $ | 7,350 | | | |
Tax Equivalent ("TE") Adjustment | | | | | $ | 659 | | | | | | | $ | 646 | | | | | | | $ | 2,397 | | | |
| (1) | The remaining loan discount on acquired loans to be accreted into loan interest income totals $51.3 million as of December 31, 2023. |
5
Noninterest Income and Expense
| | Three Months Ended | | Twelve Months Ended | | |||||||||||||||||
| | Dec. 31, | | Sep. 30, | | Jun. 30, | | Mar. 31, | | Dec. 31, | | Dec. 31, | | Dec. 31, | | |||||||
(Dollars in thousands) | | 2023 | | 2023 | | 2023 | | 2023 | | 2022 | | 2023 | | 2022 | | |||||||
Noninterest Income: | | | | | | | | | | | | | | | | | | | | | | |
Fees on deposit accounts | | $ | 33,225 | | $ | 32,830 | | $ | 33,101 | | $ | 29,859 | | $ | 33,612 | | $ | 129,015 | | $ | 124,810 | |
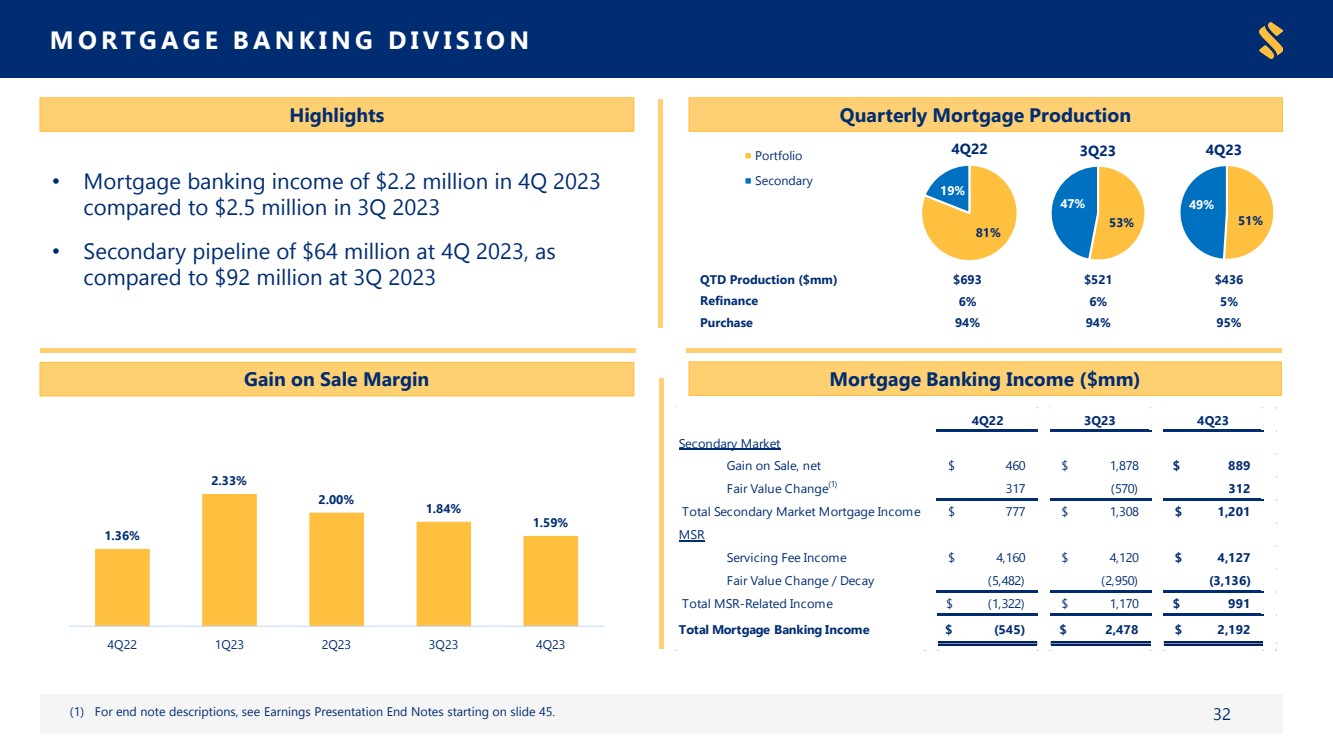
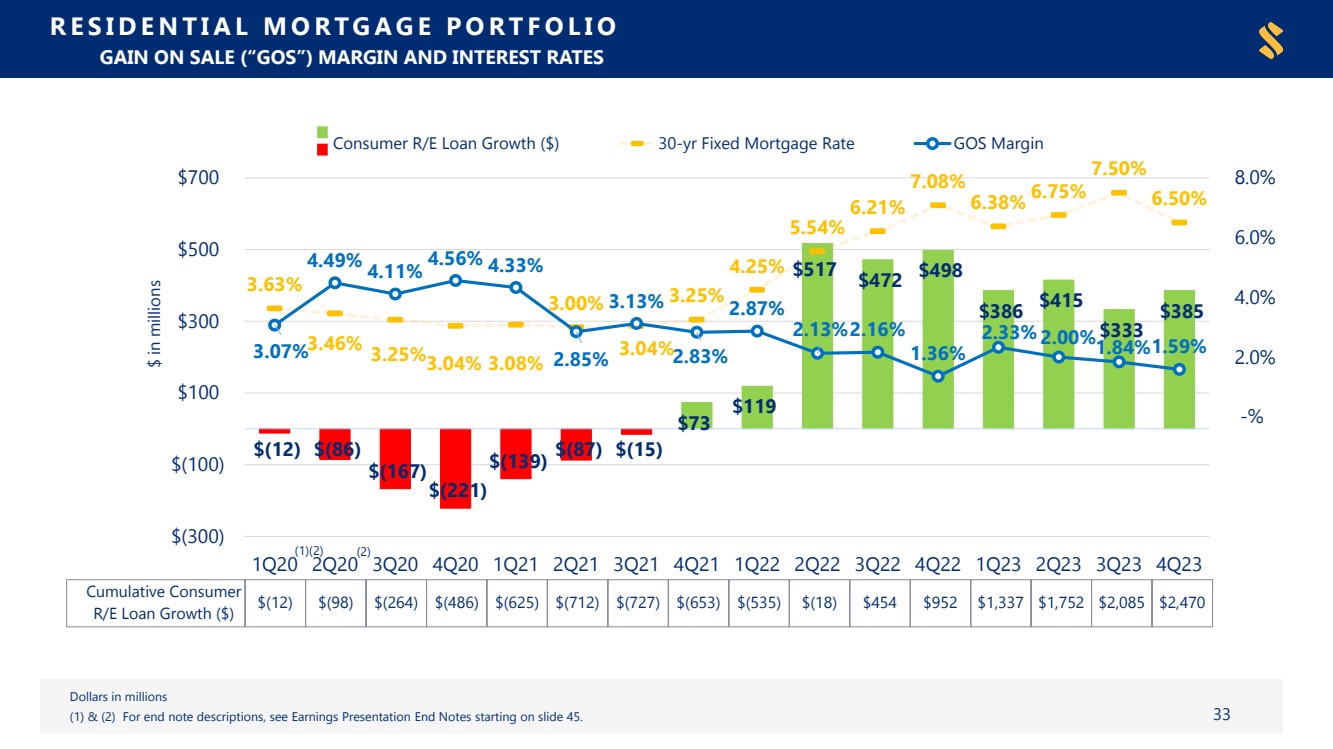
Mortgage banking income (loss) | | | 2,191 | | | 2,478 | | | 4,354 | | | 4,332 | | | (545) | | | 13,355 | | | 17,790 | |
Trust and investment services income | | | 10,131 | | | 9,556 | | | 9,823 | | | 9,937 | | | 9,867 | | | 39,447 | | | 39,019 | |
Securities (losses) gains, net | | | (2) | | | — | | | — | | | 45 | | | — | | | 43 | | | 30 | |
Correspondent banking and capital markets income | | | 16,081 | | | 24,808 | | | 27,734 | | | 21,956 | | | 16,760 | | | 90,579 | | | 92,910 | |
Expense on centrally-cleared variation margin | | | (12,677) | | | (11,892) | | | (8,547) | | | (8,362) | | | (8,451) | | | (41,478) | | | (14,155) | |
Total correspondent banking and capital markets income | | | 3,404 | | | 12,916 | | | 19,187 | | | 13,594 | | | 8,309 | | | 49,101 | | | 78,755 | |
Bank owned life insurance income | | | 6,567 | | | 7,039 | | | 6,271 | | | 6,813 | | | 6,723 | | | 26,690 | | | 24,311 | |
Other | | | 9,973 | | | 8,029 | | | 4,478 | | | 6,775 | | | 5,426 | | | 29,255 | | | 24,532 | |
Total Noninterest Income | | $ | 65,489 | | $ | 72,848 | | $ | 77,214 | | $ | 71,355 | | $ | 63,392 | | $ | 286,906 | | $ | 309,247 | |
| | | | | | | | | | | | | | | | | | | | | | |
Noninterest Expense: | | | | | | | | | | | | | | | | | | | | | | |
Salaries and employee benefits | | $ | 145,850 | | $ | 146,146 | | $ | 147,342 | | $ | 144,060 | | $ | 140,440 | | $ | 583,398 | | $ | 554,704 | |
Occupancy expense | | | 22,715 | | | 22,251 | | | 22,196 | | | 21,533 | | | 22,412 | | | 88,695 | | | 89,501 | |
Information services expense | | | 22,000 | | | 21,428 | | | 21,119 | | | 19,925 | | | 19,847 | | | 84,472 | | | 79,701 | |
OREO and loan related (income) expense | | | 948 | | | 613 | | | (14) | | | 169 | | | 78 | | | 1,716 | | | 369 | |
Business development and staff related | | | 7,492 | | | 5,995 | | | 6,672 | | | 5,957 | | | 5,851 | | | 26,116 | | | 20,133 | |
Amortization of intangibles | | | 6,615 | | | 6,616 | | | 7,028 | | | 7,299 | | | 8,027 | | | 27,558 | | | 33,205 | |
Professional fees | | | 7,025 | | | 3,456 | | | 4,364 | | | 3,702 | | | 3,756 | | | 18,547 | | | 15,331 | |
Supplies and printing expense | | | 2,761 | | | 2,623 | | | 2,554 | | | 2,640 | | | 2,411 | | | 10,578 | | | 9,621 | |
FDIC assessment and other regulatory charges | | | 8,325 | | | 8,632 | | | 9,819 | | | 6,294 | | | 6,589 | | | 33,070 | | | 23,033 | |
Advertising and marketing | | | 2,826 | | | 3,009 | | | 1,521 | | | 2,118 | | | 2,669 | | | 9,474 | | | 8,888 | |
Other operating expenses | | | 19,217 | | | 17,273 | | | 18,217 | | | 17,396 | | | 15,877 | | | 72,103 | | | 64,327 | |
Merger, branch consolidation and severance related expense | | | 1,778 | | | 164 | | | 1,808 | | | 9,412 | | | 1,542 | | | 13,162 | | | 30,888 | |
FDIC special assessment | | | 25,691 | | | — | | | — | | | — | | | — | | | 25,691 | | | — | |
Total Noninterest Expense | | $ | 273,243 | | $ | 238,206 | | $ | 242,626 | | $ | 240,505 | | $ | 229,499 | | $ | 994,580 | | $ | 929,701 | |
* During the first quarter of 2023, the Company recorded $8.1 million in severance payments, which are included in the Merger, branch consolidation and severance related expense in the table above.
6
Loans and Deposits
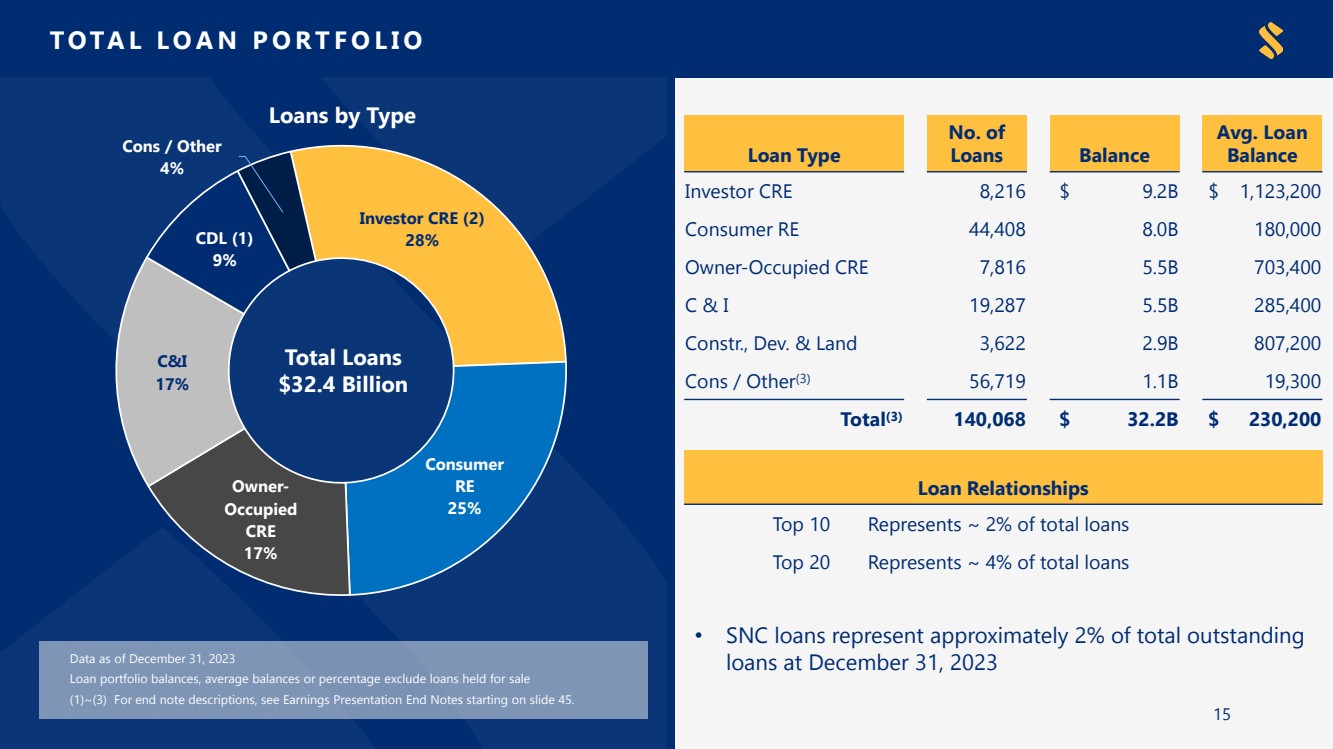
The following table presents a summary of the loan portfolio by type:
| | Ending Balance | | |||||||||||||
(Dollars in thousands) | | Dec. 31, | | Sep. 30, | | Jun. 30, | | Mar. 31, | | Dec. 31, | | |||||
LOAN PORTFOLIO (7) | | 2023 | | 2023 | | 2023 | | 2023 | | 2022 | | |||||
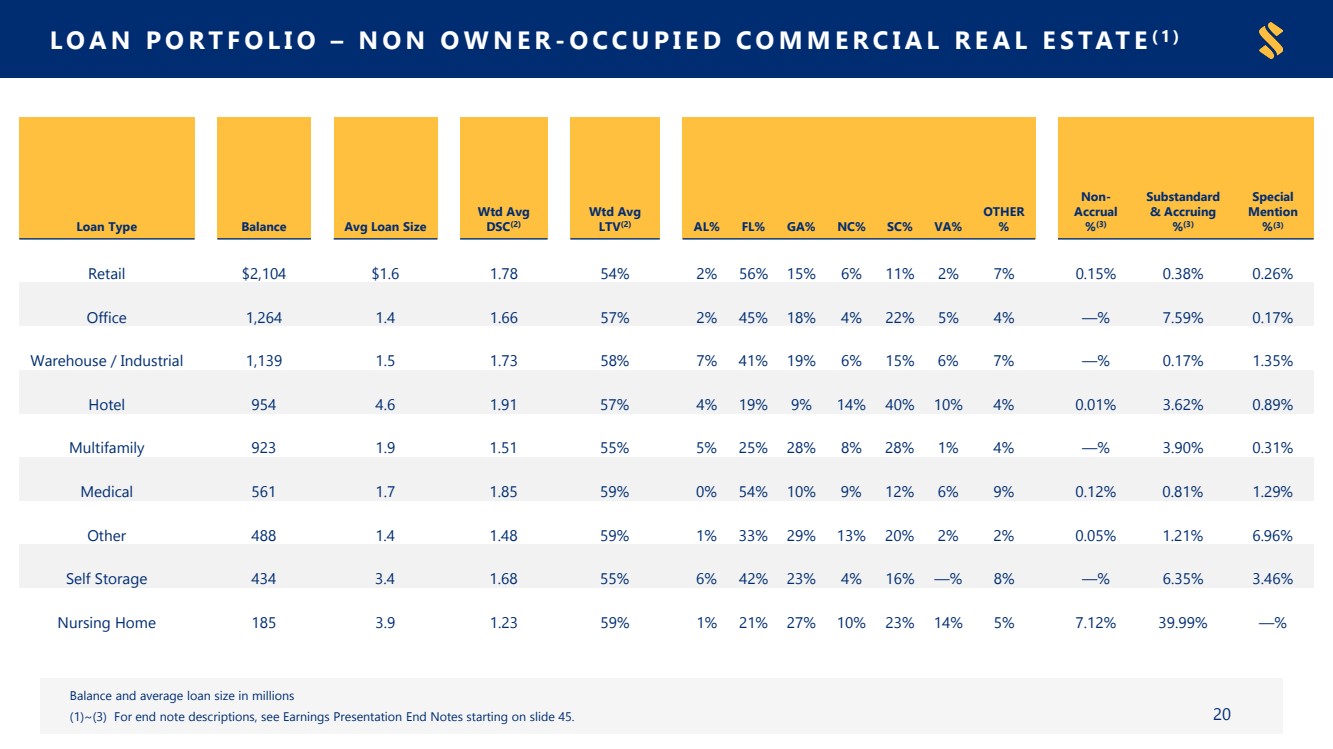
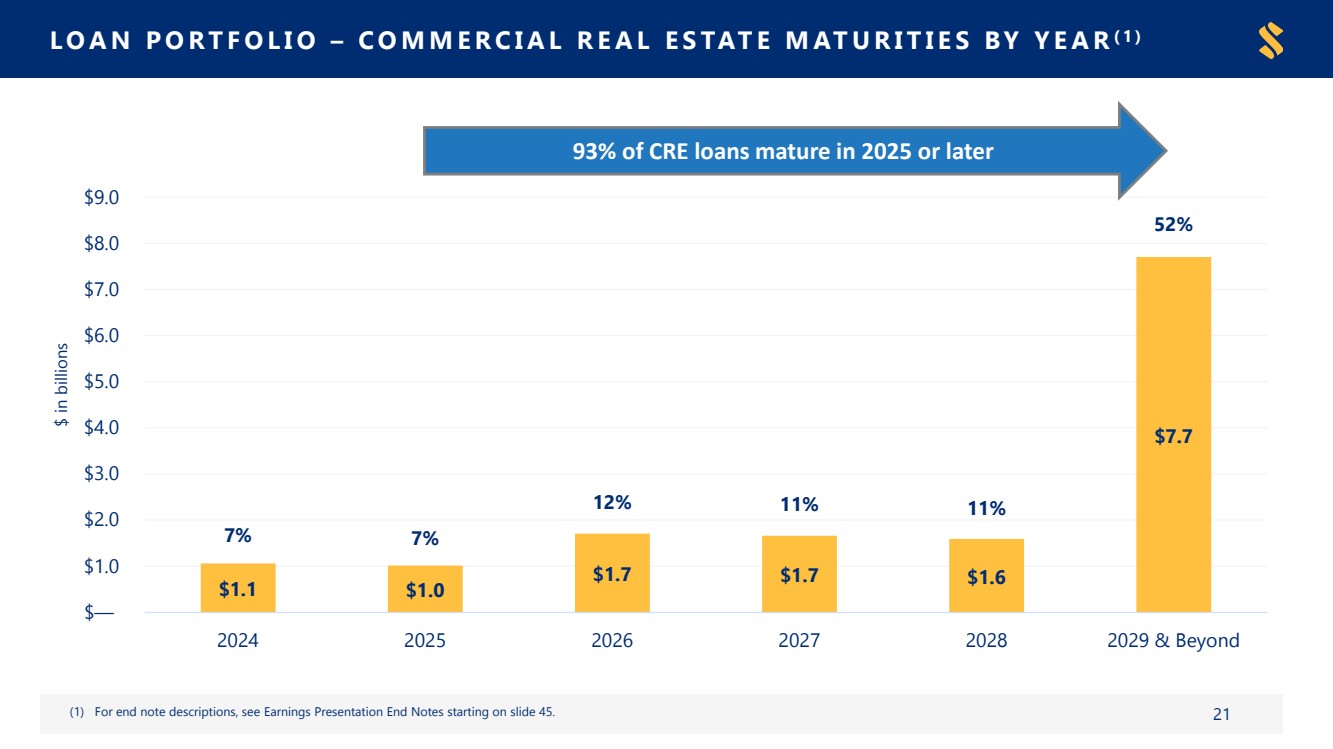
Construction and land development * † | | $ | 2,923,514 | | $ | 2,776,241 | | $ | 2,817,125 | | $ | 2,749,290 | | $ | 2,860,360 | |
Investor commercial real estate* | | | 9,227,968 | | | 9,372,683 | | | 9,187,948 | | | 8,957,507 | | | 8,769,201 | |
Commercial owner occupied real estate | | | 5,497,671 | | | 5,539,097 | | | 5,585,951 | | | 5,522,514 | | | 5,460,193 | |
Commercial and industrial | | | 5,504,539 | | | 5,458,229 | | | 5,378,294 | | | 5,321,306 | | | 5,313,483 | |
Consumer real estate * | | | 7,993,450 | | | 7,608,145 | | | 7,275,495 | | | 6,860,831 | | | 6,475,210 | |
Consumer/other | | | 1,241,347 | | | 1,262,277 | | | 1,291,972 | | | 1,284,694 | | | 1,299,415 | |
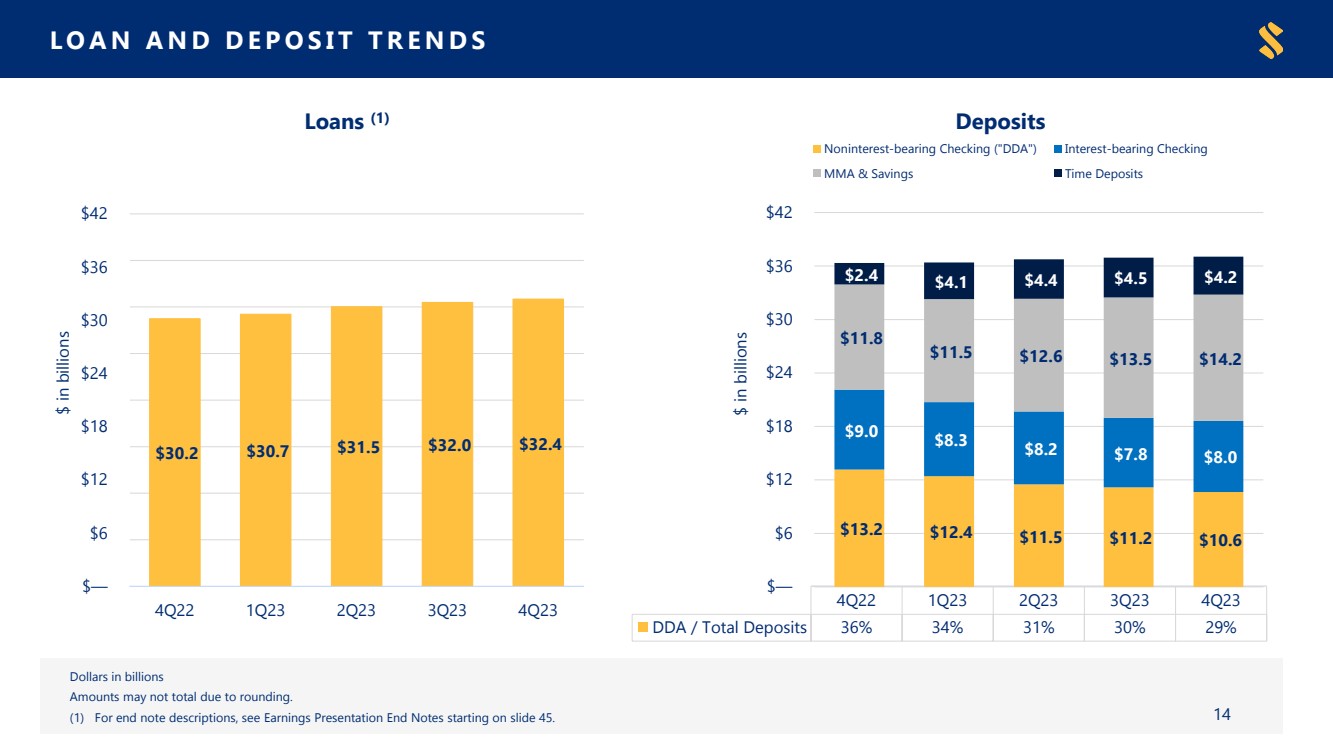
Total Loans | | $ | 32,388,489 | | $ | 32,016,672 | | $ | 31,536,785 | | $ | 30,696,142 | | $ | 30,177,862 | |
* Single family home construction-to-permanent loans originated by the Company’s mortgage banking division are included in construction and land development category until completion. Investor commercial real estate loans include commercial non-owner occupied real estate and other income producing property. Consumer real estate includes consumer owner occupied real estate and home equity loans.
† Includes single family home construction-to-permanent loans of $715.5 million, $863.1 million, $928.4 million, $893.7 million, and $904.1 million, for the quarters ended December 31, 2023, September 30, 2023, June 30, 2023, March 31, 2023, and December 31, 2022, respectively.
| | Ending Balance | | |||||||||||||
(Dollars in thousands) | | Dec. 31, | | Sep. 30, | | Jun. 30, | | Mar. 31, | | Dec. 31, | | |||||
DEPOSITS | | 2023 | | 2023 | | 2023 | | 2023 | | 2022 | | |||||
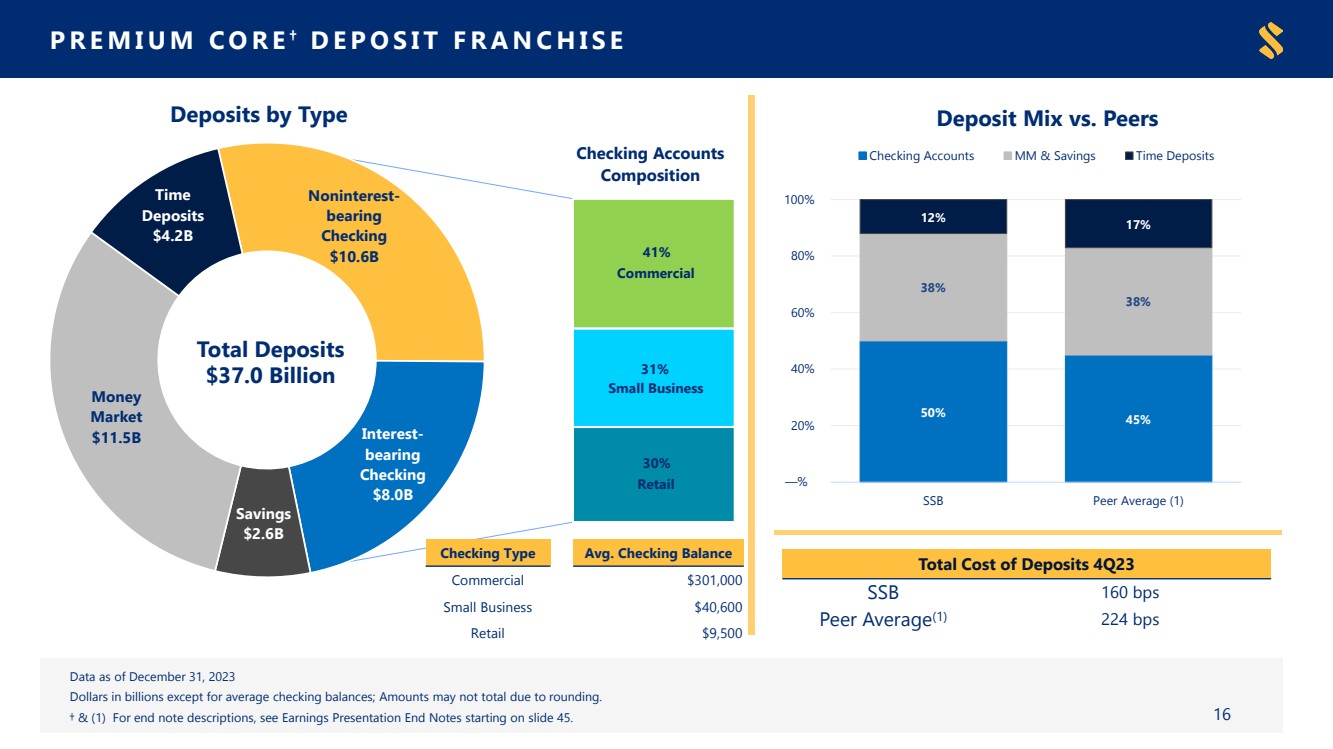
Noninterest-bearing checking | | $ | 10,649,274 | | $ | 11,158,431 | | $ | 11,489,483 | | $ | 12,422,583 | | $ | 13,168,656 | |
Interest-bearing checking | | | 7,978,799 | | | 7,806,243 | | | 8,185,609 | | | 8,316,023 | | | 8,955,519 | |
Savings | | | 2,632,212 | | | 2,760,166 | | | 2,931,320 | | | 3,156,214 | | | 3,464,351 | |
Money market | | | 11,538,671 | | | 10,756,431 | | | 9,710,032 | | | 8,388,275 | | | 8,342,111 | |
Time deposits | | | 4,249,953 | | | 4,453,927 | | | 4,425,434 | | | 4,118,497 | | | 2,419,986 | |
Total Deposits | | $ | 37,048,909 | | $ | 36,935,198 | | $ | 36,741,878 | | $ | 36,401,592 | | $ | 36,350,623 | |
| | | | | | | | | | | | | | | | |
Core Deposits (excludes Time Deposits) | | $ | 32,798,956 | | $ | 32,481,271 | | $ | 32,316,444 | | $ | 32,283,095 | | $ | 33,930,637 | |
7
Asset Quality
| | Ending Balance | | |||||||||||||
| | Dec. 31, | | Sep. 30, | | Jun. 30, | | Mar. 31, | | Dec. 31, | | |||||
(Dollars in thousands) | | 2023 | | 2023 | | 2023 | | 2023 | | 2022 | | |||||
NONPERFORMING ASSETS: | | | | | | | | | | | | | | | | |
Non-acquired | | | | | | | | | | | | | | | | |
Non-acquired nonaccrual loans and restructured loans on nonaccrual | | $ | 110,467 | | $ | 105,856 | | $ | 104,772 | | $ | 68,176 | | $ | 44,671 | |
Accruing loans past due 90 days or more | | | 11,305 | | | 783 | | | 3,620 | | | 2,667 | | | 2,358 | |
Non-acquired OREO and other nonperforming assets | | | 711 | | | 449 | | | 227 | | | 186 | | | 245 | |
Total non-acquired nonperforming assets | | | 122,483 | | | 107,088 | | | 108,619 | | | 71,029 | | | 47,274 | |
Acquired | | | | | | | | | | | | | | | | |
Acquired nonaccrual loans and restructured loans on nonaccrual | | | 59,755 | | | 57,464 | | | 60,734 | | | 52,795 | | | 59,554 | |
Accruing loans past due 90 days or more | | | 1,174 | | | 1,821 | | | 571 | | | 983 | | | 1,992 | |
Acquired OREO and other nonperforming assets | | | 712 | | | 378 | | | 981 | | | 3,446 | | | 922 | |
Total acquired nonperforming assets | | | 61,641 | | | 59,663 | | | 62,286 | | | 57,224 | | | 62,468 | |
Total nonperforming assets | | $ | 184,124 | | $ | 166,751 | | $ | 170,905 | | $ | 128,253 | | $ | 109,742 | |
| | Three Months Ended | | |||||||||||||
| | Dec. 31, | | Sep. 30, | | Jun. 30, | | Mar. 31, | | Dec. 31, | | |||||
| | 2023 | | 2023 | | 2023 | | 2023 | | 2022 | | |||||
ASSET QUALITY RATIOS (7): | | | | | | | | | | | | | | | | |
Allowance for credit losses as a percentage of loans | | | 1.41% | | | 1.40% | | | 1.36% | | | 1.21% | | | 1.18% | |
Allowance for credit losses, including reserve for unfunded commitments, as a percentage of loans | | | 1.58% | | | 1.59% | | | 1.56% | | | 1.48% | | | 1.40% | |
Allowance for credit losses as a percentage of nonperforming loans | | | 249.90% | | | 269.98% | | | 251.86% | | | 297.42% | | | 328.29% | |
Net charge-offs (recoveries) as a percentage of average loans (annualized) | | | 0.09% | | | 0.16% | | | 0.04% | | | 0.01% | | | 0.01% | |
Total nonperforming assets as a percentage of total assets | | | 0.41% | | | 0.37% | | | 0.38% | | | 0.29% | | | 0.25% | |
Nonperforming loans as a percentage of period end loans | | | 0.56% | | | 0.52% | | | 0.54% | | | 0.41% | | | 0.36% | |
Current Expected Credit Losses (“CECL”)
Below is a table showing the roll forward of the ACL and UFC for the fourth quarter of 2023:
| | Allowance for Credit Losses ("ACL and UFC") | | ||||||||||
(Dollars in thousands) | | NonPCD ACL | | PCD ACL | | Total ACL | | UFC | | ||||
Ending balance 9/30/2023 | | $ | 409,850 | | $ | 38,106 | | $ | 447,956 | | $ | 62,347 | |
Charge offs | | | (8,398) | | | — | | | (8,398) | | | — | |
Acquired charge offs | | | (1,307) | | | (768) | | | (2,075) | | | — | |
Recoveries | | | 1,416 | | | — | | | 1,416 | | | — | |
Acquired recoveries | | | 788 | | | 948 | | | 1,736 | | | — | |
Provision (recovery) for credit losses | | | 21,527 | | | (5,589) | | | 15,938 | | | (6,044) | |
Ending balance 12/31/2023 | | $ | 423,876 | | $ | 32,697 | | $ | 456,573 | | $ | 56,303 | |
| | | | | | | | | | | | | |
Period end loans | | $ | 31,279,676 | | $ | 1,108,813 | | $ | 32,388,489 | | | N/A | |
Allowance for Credit Losses to Loans | | | 1.36% | | | 2.95% | | | 1.41% | | | N/A | |
Unfunded commitments (off balance sheet) * | | | | | | | | | | | $ | 8,457,055 | |
Reserve to unfunded commitments (off balance sheet) | | | | | | | | | | | | 0.67% | |
* Unfunded commitments exclude unconditionally cancelable commitments and letters of credit.
Conference Call
The Company will host a conference call to discuss its fourth quarter results at 9:00 a.m. Eastern Time on January 26, 2024. Callers wishing to participate may call toll-free by dialing (888) 350-3899 within the US and (646) 960-0343 for all other locations. The numbers for international participants are listed at https://events.q4irportal.com/custom/access/2324/. The conference ID number is 4200408. Alternatively, individuals may listen to the live webcast of the presentation by visiting SouthStateBank.com. An audio replay of the live webcast is expected to be available by the evening of January 26, 2024 on the Investor Relations section of SouthStateBank.com.
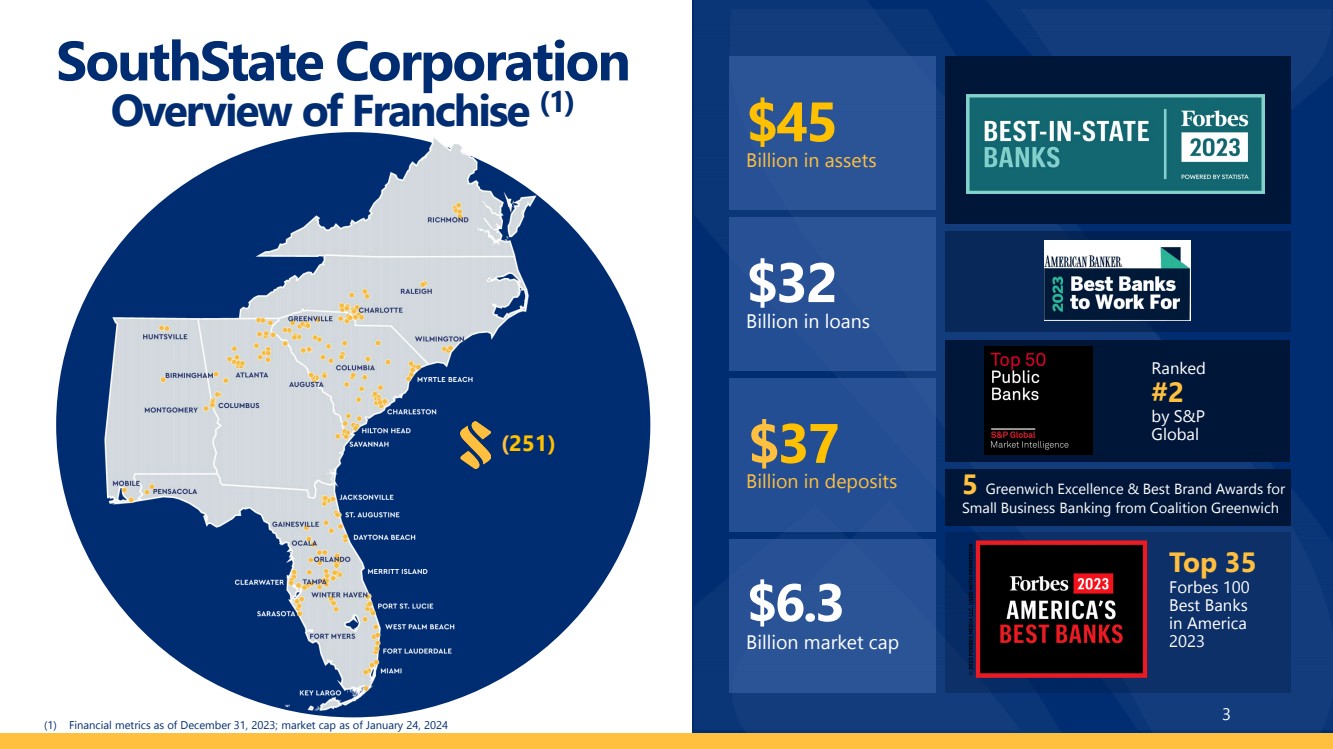
SouthState Corporation is a financial services company headquartered in Winter Haven, Florida. SouthState Bank, N.A., the Company’s nationally chartered bank subsidiary, provides consumer, commercial, mortgage and wealth management solutions to more than one million customers throughout Florida, Alabama, Georgia, the Carolinas and Virginia. The Bank also serves clients coast to coast through its correspondent banking division. Additional information is available at SouthStateBank.com.
###
8
Non-GAAP Measures
Statements included in this press release include non-GAAP measures and should be read along with the accompanying tables that provide a reconciliation of non-GAAP measures to GAAP measures. Although other companies may use calculation methods that differ from those used by SouthState for non-GAAP measures, management believes that these non-GAAP measures provide additional useful information, which allows readers to evaluate the ongoing performance of the Company. Non-GAAP measures should not be considered as an alternative to any measure of performance or financial condition as promulgated under GAAP, and investors should consider the Company's performance and financial condition as reported under GAAP and all other relevant information when assessing the performance or financial condition of the Company. Non-GAAP measures have limitations as analytical tools, and investors should not consider them in isolation or as a substitute for analysis of the Company's results or financial condition as reported under GAAP.
(Dollars and shares in thousands, except per share data) | | Three Months Ended | | |||||||||||||||||
PRE-PROVISION NET REVENUE ("PPNR") (NON-GAAP) | | Dec. 31, 2023 | | | Sep. 30, 2023 | | | Jun. 30, 2023 | | | Mar. 31, 2023 | | | Dec. 31, 2022 | | |||||
Net income (GAAP) | | $ | 106,791 | | | $ | 124,144 | | | $ | 123,447 | | | $ | 139,926 | | | $ | 143,502 | |
Provision for credit losses | | | 9,893 | | | | 32,709 | | | | 38,389 | | | | 33,091 | | | | 47,142 | |
Tax provision | | | 29,793 | | | | 33,160 | | | | 34,495 | | | | 39,096 | | | | 39,253 | |
Merger, branch consolidation and severance related expense | | | 1,778 | | | | 164 | | | | 1,808 | | | | 9,412 | | | | 1,542 | |
FDIC special assessment | | | 25,691 | | | | — | | | | — | | | | — | | | | — | |
Securities losses (gains) | | | 2 | | | | — | | | | — | | | | (45) | | | | — | |
Pre-provision net revenue (PPNR) (Non-GAAP) | | $ | 173,948 | | | $ | 190,177 | | | $ | 198,139 | | | $ | 221,480 | | | $ | 231,439 | |
| | | | | | | | | | | | | | | | | | | | |
Average asset balance (GAAP) | | $ | 45,037,632 | | | $ | 44,841,319 | | | $ | 44,628,124 | | | $ | 44,104,478 | | | $ | 44,429,894 | |
PPNR ROAA | | | 1.53 | % | | | 1.68 | % | | | 1.78 | % | | | 2.04 | % | | | 2.07 | % |
| | | | | | | | | | | | | | | | | | | | |
Diluted weighted-average common shares outstanding | | | 76,634 | | | | 76,571 | | | | 76,418 | | | | 76,389 | | | | 76,327 | |
PPNR per weighted-average common shares outstanding | | $ | 2.27 | | | $ | 2.48 | | | $ | 2.59 | | | $ | 2.90 | | | $ | 3.03 | |
(Dollars in thousands) | | Three Months Ended | | |||||||||||||||||
CORE NET INTEREST INCOME (NON-GAAP) | | Dec. 31, 2023 | | | Sep. 30, 2023 | | | Jun. 30, 2023 | | | Mar. 31, 2023 | | | Dec. 31, 2022 | | |||||
Net interest income (GAAP) | | $ | 354,231 | | | $ | 355,371 | | | $ | 361,743 | | | $ | 381,263 | | | $ | 396,004 | |
Less: | | | | | | | | | | | | | | | | | | | | |
Total accretion on acquired loans | | | 3,870 | | | | 4,053 | | | | 5,481 | | | | 7,398 | | | | 7,350 | |
Core net interest income (Non-GAAP) | | $ | 350,361 | | | $ | 351,318 | | | $ | 356,262 | | | $ | 373,865 | | | $ | 388,654 | |
| | | | | | | | | | | | | | | | | | | | |
NET INTEREST MARGIN ("NIM"), TE (NON-GAAP) | | | | | | | | | | | | | | | | | | | | |
Net interest income (GAAP) | | $ | 354,231 | | | $ | 355,371 | | | $ | 361,743 | | | $ | 381,263 | | | $ | 396,004 | |
Total average interest-earning assets | | | 40,465,377 | | | | 40,376,380 | | | | 40,127,836 | | | | 39,409,340 | | | | 39,655,736 | |
NIM, non-tax equivalent | | | 3.47 | % | | | 3.49 | % | | | 3.62 | % | | | 3.92 | % | | | 3.96 | % |
| | | | | | | | | | | | | | | | | | | | |
Tax equivalent adjustment (included in NIM, TE) | | | 659 | | | | 646 | | | | 698 | | | | 1,020 | | | | 2,397 | |
Net interest income, tax equivalent (Non-GAAP) | | $ | 354,890 | | | $ | 356,017 | | | $ | 362,441 | | | $ | 382,283 | | | $ | 398,401 | |
NIM, TE (Non-GAAP) | | | 3.48 | % | | | 3.50 | % | | | 3.62 | % | | | 3.93 | % | | | 3.99 | % |
9
| | Three Months Ended | | | Twelve Months Ended | | ||||||||||||||||||||||
(Dollars in thousands, except per share data) | | Dec. 31, | | | Sep. 30, | | | Jun. 30, | | | Mar. 31, | | | Dec. 31, | | | Dec. 31, | | | Dec. 31, | | |||||||
RECONCILIATION OF GAAP TO NON-GAAP | | 2023 | | | 2023 | | | 2023 | | | 2023 | | | 2022 | | | 2023 | | | 2022 | | |||||||
Adjusted Net Income (non-GAAP) (2) | | | | | | | | | | | | | | | | | | | | | | | | | | | | |
Net income (GAAP) | | $ | 106,791 | | | $ | 124,144 | | | $ | 123,447 | | | $ | 139,926 | | | $ | 143,502 | | | $ | 494,308 | | | $ | 496,049 | |
Securities losses (gains), net of tax | | | 2 | | | | — | | | | — | | | | (35) | | | | — | | | | (33) | | | | (24) | |
PCL - NonPCD loans and UFC, net of tax | | | — | | | | — | | | | — | | | | — | | | | — | | | | — | | | | 13,492 | |
Merger, branch consolidation and severance related expense, net of tax | | | 1,391 | | | | 130 | | | | 1,414 | | | | 7,356 | | | | 1,211 | | | | 10,291 | | | | 24,163 | |
FDIC special assessment, net of tax | | | 20,087 | | | | — | | | | — | | | | — | | | | — | | | | 20,087 | | | | — | |
Adjusted net income (non-GAAP) | | $ | 128,271 | | | $ | 124,274 | | | $ | 124,861 | | | $ | 147,247 | | | $ | 144,713 | | | $ | 524,653 | | | $ | 533,680 | |
| | | | | | | | | | | | | | | | | | | | | | | | | | | | |
Adjusted Net Income per Common Share - Basic (2) | | | | | | | | | | | | | | | | | | | | | | | | | | | | |
Earnings per common share - Basic (GAAP) | | $ | 1.40 | | | $ | 1.63 | | | $ | 1.62 | | | $ | 1.84 | | | $ | 1.90 | | | $ | 6.50 | | | $ | 6.65 | |
Effect to adjust for securities losses (gains) | | | 0.00 | | | | — | | | | — | | | | (0.00) | | | | — | | | | (0.00) | | | | (0.00) | |
Effect to adjust for PCL - NonPCD loans and UFC, net of tax | | | — | | | | — | | | | — | | | | — | | | | — | | | | — | | | | 0.19 | |
Effect to adjust for merger, branch consolidation and severance related expense, net of tax | | | 0.03 | | | | 0.00 | | | | 0.02 | | | | 0.10 | | | | 0.01 | | | | 0.14 | | | | 0.32 | |
Effect to adjust for FDIC special assessment, net of tax | | | 0.26 | | | | — | | | | — | | | | — | | | | — | | | | 0.26 | | | | — | |
Adjusted net income per common share - Basic (non-GAAP) | | $ | 1.69 | | | $ | 1.63 | | | $ | 1.64 | | | $ | 1.94 | | | $ | 1.91 | | | $ | 6.90 | | | $ | 7.16 | |
| | | | | | | | | | | | | | | | | | | | | | | | | | | | |
Adjusted Net Income per Common Share - Diluted (2) | | | | | | | | | | | | | | | | | | | | | | | | | | | | |
Earnings per common share - Diluted (GAAP) | | $ | 1.39 | | | $ | 1.62 | | | $ | 1.62 | | | $ | 1.83 | | | $ | 1.88 | | | $ | 6.46 | | | $ | 6.60 | |
Effect to adjust for securities losses (gains) | | | 0.00 | | | | — | | | | — | | | | (0.00) | | | | — | | | | (0.00) | | | | (0.00) | |
Effect to adjust for PCL - NonPCD loans and UFC, net of tax | | | — | | | | — | | | | — | | | | — | | | | — | | | | — | | | | 0.18 | |
Effect to adjust for merger, branch consolidation and severance related expense, net of tax | | | 0.02 | | | | 0.00 | | | | 0.01 | | | | 0.10 | | | | 0.02 | | | | 0.14 | | | | 0.32 | |
Effect to adjust for FDIC special assessment, net of tax | | | 0.26 | | | | — | | | | — | | | | — | | | | — | | | | 0.26 | | | | — | |
Adjusted net income per common share - Diluted (non-GAAP) | | $ | 1.67 | | | $ | 1.62 | | | $ | 1.63 | | | $ | 1.93 | | | $ | 1.90 | | | $ | 6.86 | | | $ | 7.10 | |
| | | | | | | | | | | | | | | | | | | | | | | | | | | | |
Adjusted Return on Average Assets (2) | | | | | | | | | | | | | | | | | | | | | | | | | | | | |
Return on average assets (GAAP) | | | 0.94 | % | | | 1.10 | % | | | 1.11 | % | | | 1.29 | % | | | 1.28 | % | | | 1.11 | % | | | 1.12 | % |
Effect to adjust for securities losses (gains) | | | 0.00 | % | | | — | % | | | — | % | | | (0.00) | % | | | — | % | | | (0.00) | % | | | (0.00) | % |
Effect to adjust for PCL - NonPCD loans and UFC, net of tax | | | — | % | | | — | % | | | — | % | | | — | % | | | — | % | | | — | % | | | 0.03 | % |
Effect to adjust for merger, branch consolidation and severance related expense, net of tax | | | 0.01 | % | | | — | % | | | 0.01 | % | | | 0.06 | % | | | 0.01 | % | | | 0.02 | % | | | 0.05 | % |
Effect to adjust for FDIC special assessment, net of tax | | | 0.18 | % | | | — | % | | | — | % | | | — | % | | | — | % | | | 0.04 | % | | | — | % |
Adjusted return on average assets (non-GAAP) | | | 1.13 | % | | | 1.10 | % | | | 1.12 | % | | | 1.35 | % | | | 1.29 | % | | | 1.17 | % | | | 1.20 | % |
| | | | | | | | | | | | | | | | | | | | | | | | | | | | |
Adjusted Return on Average Common Equity (2) | | | | | | | | | | | | | | | | | | | | | | | | | | | | |
Return on average common equity (GAAP) | | | 7.99 | % | | | 9.24 | % | | | 9.34 | % | | | 10.96 | % | | | 11.41 | % | | | 9.37 | % | | | 9.84 | % |
Effect to adjust for securities losses (gains) | | | 0.00 | % | | | — | % | | | — | % | | | (0.00) | % | | | — | % | | | (0.00) | % | | | (0.00) | % |
Effect to adjust for PCL - NonPCD loans and UFC, net of tax | | | — | % | | | — | % | | | — | % | | | — | % | | | — | % | | | — | % | | | 0.27 | % |
Effect to adjust for merger, branch consolidation and severance related expense, net of tax | | | 0.11 | % | | | 0.01 | % | | | 0.11 | % | | | 0.57 | % | | | 0.09 | % | | | 0.19 | % | | | 0.48 | % |
Effect to adjust for FDIC special assessment, net of tax | | | 1.50 | % | | | — | % | | | — | % | | | — | % | | | — | % | | | 0.38 | % | | | — | % |
Adjusted return on average common equity (non-GAAP) | | | 9.60 | % | | | 9.25 | % | | | 9.45 | % | | | 11.53 | % | | | 11.50 | % | | | 9.94 | % | | | 10.59 | % |
| | | | | | | | | | | | | | | | | | | | | | | | | | | | |
Return on Average Common Tangible Equity (3) | | | | | | | | | | | | | | | | | | | | | | | | | | | | |
Return on average common equity (GAAP) | | | 7.99 | % | | | 9.24 | % | | | 9.34 | % | | | 10.96 | % | | | 11.41 | % | | | 9.37 | % | | | 9.84 | % |
Effect to adjust for intangible assets | | | 5.54 | % | | | 6.28 | % | | | 6.47 | % | | | 7.85 | % | | | 8.76 | % | | | 6.50 | % | | | 7.32 | % |
Return on average tangible equity (non-GAAP) | | | 13.53 | % | | | 15.52 | % | | | 15.81 | % | | | 18.81 | % | | | 20.17 | % | | | 15.87 | % | | | 17.16 | % |
| | | | | | | | | | | | | | | | | | | | | | | | | | | | |
Adjusted Return on Average Common Tangible Equity (2) (3) | | | | | | | | | | | | | | | | | | | | | | | | | | | | |
Return on average common equity (GAAP) | | | 7.99 | % | | | 9.24 | % | | | 9.34 | % | | | 10.96 | % | | | 11.41 | % | | | 9.37 | % | | | 9.84 | % |
Effect to adjust for securities losses (gains) | | | 0.00 | % | | | — | % | | | — | % | | | (0.00) | % | | | — | % | | | (0.00) | % | | | (0.00) | % |
Effect to adjust for PCL - NonPCD loans and UFC, net of tax | | | — | % | | | — | % | | | — | % | | | — | % | | | — | % | | | — | % | | | 0.27 | % |
Effect to adjust for merger, branch consolidation and severance related expense, net of tax | | | 0.10 | % | | | 0.01 | % | | | 0.11 | % | | | 0.58 | % | | | 0.10 | % | | | 0.20 | % | | | 0.48 | % |
Effect to adjust for FDIC special assessment, net of tax | | | 1.50 | % | | | — | % | | | — | % | | | — | % | | | — | % | | | 0.38 | % | | | — | % |
Effect to adjust for intangible assets | | | 6.53 | % | | | 6.29 | % | | | 6.53 | % | | | 8.21 | % | | | 8.82 | % | | | 6.85 | % | | | 7.81 | % |
Adjusted return on average common tangible equity (non-GAAP) | | | 16.12 | % | | | 15.54 | % | | | 15.98 | % | | | 19.75 | % | | | 20.33 | % | | | 16.80 | % | | | 18.40 | % |
| | | | | | | | | | | | | | | | | | | | | | | | | | | | |
Adjusted Efficiency Ratio (4) | | | | | | | | | | | | | | | | | | | | | | | | | | | | |
Efficiency ratio | | | 63.43 | % | | | 54.00 | % | | | 53.59 | % | | | 51.41 | % | | | 47.96 | % | | | 55.50 | % | | | 54.21 | % |
Effect to adjust for merger, branch consolidation and severance related expense | | | (0.43) | % | | | (0.04) | % | | | (0.41) | % | | | (2.07) | % | | | (0.33) | % | | | (0.76) | % | | | (1.87) | % |
Effect to adjust for FDIC special assessment | | | (6.11) | % | | | — | % | | | — | % | | | — | % | | | — | % | | | (1.47) | % | | | — | % |
Adjusted efficiency ratio | | | 56.89 | % | | | 53.96 | % | | | 53.18 | % | | | 49.34 | % | | | 47.63 | % | | | 53.27 | % | | | 52.34 | % |
| | | | | | | | | | | | | | | | | | | | | | | | | | | | |
Tangible Book Value Per Common Share (3) | | | | | | | | | | | | | | | | | | | | | | | | | | | | |
Book value per common share (GAAP) | | $ | 72.78 | | | $ | 68.81 | | | $ | 69.61 | | | $ | 69.19 | | | $ | 67.04 | | | | | | | | | |
Effect to adjust for intangible assets | | | (26.46) | | | | (26.55) | | | | (26.65) | | | | (26.79) | | | | (26.95) | | | | | | | | | |
Tangible book value per common share (non-GAAP) | | $ | 46.32 | | | $ | 42.26 | | | $ | 42.96 | | | $ | 42.40 | | | $ | 40.09 | | | | | | | | | |
| | | | | | | | | | | | | | | | | | | | | | | | | | | | |
Tangible Equity-to-Tangible Assets (3) | | | | | | | | | | | | | | | | | | | | | | | | | | | | |
Equity-to-assets (GAAP) | | | 12.32 | % | | | 11.63 | % | | | 11.77 | % | | | 11.68 | % | | | 11.56 | % | | | | | | | | |
Effect to adjust for intangible assets | | | (4.11) | % | | | (4.15) | % | | | (4.16) | % | | | (4.18) | % | | | (4.31) | % | | | | | | | | |
Tangible equity-to-tangible assets (non-GAAP) | | | 8.21 | % | | | 7.48 | % | | | 7.61 | % | | | 7.50 | % | | | 7.25 | % | | | | | | | | |
Certain prior period information has been reclassified to conform to the current period presentation, and these reclassifications have no impact on net income or equity as previously reported.
10
Footnotes to tables:
| (1) | Includes loan accretion (interest) income related to the discount on acquired loans of $3.9 million, $4.1 million, $5.5 million, $7.4 million, and $7.3 million during the quarters ended December 31, 2023, September 30, 2023, June 30, 2023, March 31, 2023, and December 31, 2022, respectively. |
| (2) | Adjusted earnings, adjusted return on average assets, adjusted EPS, and adjusted return on average equity are non-GAAP measures and exclude the gains or losses on sales of securities, merger, branch consolidation and severance related expense, initial PCL on nonPCD loans and unfunded commitments from acquisitions, and FDIC special assessments. Management believes that non-GAAP adjusted measures provide additional useful information that allows readers to evaluate the ongoing performance of the Company. Non-GAAP measures should not be considered as an alternative to any measure of performance or financial condition as promulgated under GAAP, and investors should consider the Company's performance and financial condition as reported under GAAP and all other relevant information when assessing the performance or financial condition of the Company. Non-GAAP measures have limitations as analytical tools, and investors should not consider them in isolation or as a substitute for analysis of the Company's results or financial condition as reported under GAAP. Adjusted earnings and the related adjusted return measures (non-GAAP) exclude the following from net income (GAAP) on an after-tax basis: (a) pre-tax merger, branch consolidation and severance related expense of $1.8 million, $164,000, $1.8 million, $9.4 million, and $1.5 million for the quarters ended December 31, 2023, September 30, 2023, June 30, 2023, March 31, 2023, and December 31, 2022, respectively; (b) pre-tax net securities (losses) gains of $(2,000) and $45,000 for the quarters ended December 31, 2023 and March 31, 2023, respectively; and (c) pre-tax FDIC special assessment of $25.7 million for the quarter ended December 31, 2023. |
| (3) | The tangible measures are non-GAAP measures and exclude the effect of period end or average balance of intangible assets. The tangible returns on equity and common equity measures also add back the after-tax amortization of intangibles to GAAP basis net income. Management believes that these non-GAAP tangible measures provide additional useful information, particularly since these measures are widely used by industry analysts for companies with prior merger and acquisition activities. Non-GAAP measures should not be considered as an alternative to any measure of performance or financial condition as promulgated under GAAP, and investors should consider the Company's performance and financial condition as reported under GAAP and all other relevant information when assessing the performance or financial condition of the Company. Non-GAAP measures have limitations as analytical tools, and investors should not consider them in isolation or as a substitute for analysis of the Company's results or financial condition as reported under GAAP. The sections titled "Reconciliation of GAAP to Non-GAAP" provide tables that reconcile non-GAAP measures to GAAP. |
| (4) | Adjusted efficiency ratio is calculated by taking the noninterest expense excluding merger, branch consolidation and severance related expense, FDIC special assessment and amortization of intangible assets, divided by net interest income and noninterest income excluding securities gains (losses). The pre-tax amortization expenses of intangible assets were $6.6 million, $6.6 million, $7.0 million, $7.3 million, and $8.0 million for the quarters ended December 31, 2023, September 30, 2023, June 30, 2023, March 31, 2023, and December 31, 2022, respectively. |
| (5) | The dividend payout ratio is calculated by dividing total dividends paid during the period by the total net income for the same period. |
| (6) | December 31, 2023 ratios are estimated and may be subject to change pending the final filing of the FR Y-9C; all other periods are presented as filed. |
| (7) | Loan data excludes mortgage loans held for sale. |
11
Cautionary Statement Regarding Forward Looking Statements
Statements included in this communication, which are not historical in nature are intended to be, and are hereby identified as, forward-looking statements for purposes of the safe harbor provided by Section 27A of the Securities Act of 1933 and Section 21E of the Securities Exchange Act of 1934. Forward-looking statements are based on, among other things, management’s beliefs, assumptions, current expectations, estimates and projections about the financial services industry, the economy and SouthState. Words and phrases such as “may,” “approximately,” “continue,” “should,” “expects,” “projects,” “anticipates,” “is likely,” “look ahead,” “look forward,” “believes,” “will,” “intends,” “estimates,” “strategy,” “plan,” “could,” “potential,” “possible” and variations of such words and similar expressions are intended to identify such forward-looking statements.
SouthState cautions readers that forward-looking statements are subject to certain risks, uncertainties and assumptions that are difficult to predict with regard to, among other things, timing, extent, likelihood and degree of occurrence, which could cause actual results to differ materially from anticipated results. Such risks, uncertainties and assumptions, include, among others, the following: (1) economic downturn risk, potentially resulting in deterioration in the credit markets, inflation, greater than expected noninterest expenses, excessive loan losses and other negative consequences, which risks could be exacerbated by potential negative economic developments resulting from federal spending cuts and/or one or more federal budget-related impasses or actions; (2) interest rate risk primarily resulting from the interest rate environment, the number and pace of interest rate increases, and their impact on the Bank’s earnings, including from the correspondent and mortgage divisions, housing demand, the market value of the Bank’s loan and securities portfolios, and the market value of SouthState’s equity; (3) volatility in the financial services industry (including failures or rumors of failures of other depository institutions), along with actions taken by governmental agencies to address such turmoil, could affect the ability of depository institutions, including us, to attract and retain depositors and to borrow or raise capital; (4) the impact of increasing digitization of the banking industry and movement of customers to on-line platforms, and the possible impact on the Bank’s results of operations, customer base, expenses, suppliers and operations; (5) controls and procedures risk, including the potential failure or circumvention of our controls and procedures or failure to comply with regulations related to controls and procedures; (6) potential deterioration in real estate values; (7) the impact of competition with other financial institutions, including deposit and loan pricing pressures and the resulting impact, including as a result of compression to net interest margin; (8) risks relating to the ability to retain our culture and attract and retain qualified people, which could be exacerbated by the continuing work from remote environment; (9) credit risks associated with an obligor’s failure to meet the terms of any contract with the Bank or otherwise fail to perform as agreed under the terms of any loan-related document; (10) risks related to the ability of the Company to pursue its strategic plans which depend upon certain growth goals in our lines of business; (11) liquidity risk affecting the Bank’s ability to meet its obligations when they come due; (12) risks associated with an anticipated increase in SouthState’s investment securities portfolio, including risks associated with acquiring and holding investment securities or potentially determining that the amount of investment securities SouthState desires to acquire are not available on terms acceptable to SouthState; (13) unexpected outflows of uninsured deposits may require us to sell investment securities at a loss; (14) the loss of value of our investment portfolio could negatively impact market perceptions of us and could lead to deposit withdrawals; (15) price risk focusing on changes in market factors that may affect the value of traded instruments in “mark-to-market” portfolios; (16) transaction risk arising from problems with service or product delivery; (17) compliance risk involving risk to earnings or capital resulting from violations of or nonconformance with laws, rules, regulations, prescribed practices, or ethical standards; (18) regulatory change risk resulting from new laws, rules, regulations, accounting principles, proscribed practices or ethical standards, including, without limitation, the possibility that regulatory agencies may require higher levels of capital above the current regulatory-mandated minimums and including the impact of special FDIC assessments, the Consumer Financial Protection Bureau regulations or other guidance, and the possibility of changes in accounting standards, policies, principles and practices; (19) strategic risk resulting from adverse business decisions or improper implementation of business decisions; (20) reputation risk that adversely affects earnings or capital arising from negative public opinion including the effects of social media on market perceptions of us and banks generally; (21) cybersecurity risk related to the dependence of SouthState on internal computer systems and the technology of outside service providers, as well as the potential impacts of internal or external security breaches, which may subject the Company to potential business disruptions or financial losses resulting from deliberate attacks or unintentional events; (22) reputational and operational risks associated with environment, social and governance (ESG) matters, including the impact of recently passed state legislation and proposed federal and state regulatory guidance and regulation relating to climate change; (23) greater than expected noninterest expenses; (24) excessive loan losses; (25) reputational risk and possible higher than estimated reduced revenue from previously announced changes in the Bank’s consumer overdraft programs and other deposit products; (26) the risks of fluctuations in market prices for SouthState common stock that may or may not reflect economic condition or performance of SouthState; (27) the payment of dividends on SouthState common stock, which is subject to legal and regulatory limitations as well as the discretion of the board of directors of SouthState, SouthState’s performance and other factors; (28) ownership dilution risk associated with potential acquisitions in which SouthState’s stock may be issued as consideration for an acquired company; (29) operational, technological, cultural, regulatory, legal, credit and other risks associated with the exploration, consummation and integration of potential future acquisitions, whether involving stock or cash consideration; (30) catastrophic events such as hurricanes, tornados, earthquakes, floods or other natural or human disasters, including public health crises and infectious disease outbreaks, as well as any government actions in response to such events, and the related disruption to local, regional and global economic activity and financial markets, and the impact that any of the foregoing may have on SouthState and its customers and other constituencies; (31) geopolitical risk from terrorist activities and armed conflicts that may result in economic and supply disruptions, and loss of market and consumer confidence; and (32) other factors that may affect future results of SouthState, as disclosed in SouthState’s Annual Report on Form 10-K, Quarterly Reports on Form 10-Q, and Current Reports on Form 8-K, filed by SouthState with the U.S. Securities and Exchange Commission (“SEC”) and available on the SEC’s website at http://www.sec.gov, any of which could cause actual results to differ materially from future results expressed, implied or otherwise anticipated by such forward-looking statements.
12
All forward-looking statements speak only as of the date they are made and are based on information available at that time. SouthState does not undertake any obligation to update or otherwise revise any forward-looking statements, whether as a result of new information, future events, or otherwise, except as required by federal securities laws. As forward-looking statements involve significant risks and uncertainties, caution should be exercised against placing undue reliance on such statements.
13
| Earnings Call 4Q 2023 January 26, 2024 |
| DISCLAIMER 2 Statements included in this communication, which are not historical in nature are intended to be, and are hereby identified as, forward-looking statements for purposes of the safe harbor provided by Section 27A of the Securities Act of 1933 and Section 21E of the Securities Exchange Act of 1934. Forward-looking statements are based on, among other things, management’s beliefs, assumptions, current expectations, estimates and projections about the financial services industry, the economy and SouthState. Words and phrases such as “may,” “approximately,” “continue,” “should,” “expects,” “projects,” “anticipates,” “is likely,” “look ahead,” “look forward,” “believes,” “will,” “intends,” “estimates,” “strategy,” “plan,” “could,” “potential,” “possible” and variations of such words and similar expressions are intended to identify such forward-looking statements. SouthState cautions readers that forward-looking statements are subject to certain risks, uncertainties and assumptions that are difficult to predict with regard to, among other things, timing, extent, likelihood and degree of occurrence, which could cause actual results to differ materially from anticipated results. Such risks, uncertainties and assumptions, include, among others, the following: (1) economic downturn risk, potentially resulting in deterioration in the credit markets, inflation, greater than expected noninterest expenses, excessive loan losses and other negative consequences, which risks could be exacerbated by potential negative economic developments resulting from federal spending cuts and/or one or more federal budget-related impasses or actions; (2) interest rate risk primarily resulting from the interest rate environment, the number and pace of interest rate increases, and their impact on the Bank’s earnings, including from the correspondent and mortgage divisions, housing demand, the market value of the Bank’s loan and securities portfolios, and the market value of SouthState’s equity; (3) volatility in the financial services industry (including failures or rumors of failures of other depository institutions), along with actions taken by governmental agencies to address such turmoil, could affect the ability of depository institutions, including us, to attract and retain depositors and to borrow or raise capital; (4) the impact of increasing digitization of the banking industry and movement of customers to on-line platforms, and the possible impact on the Bank’s results of operations, customer base, expenses, suppliers and operations; (5) controls and procedures risk, including the potential failure or circumvention of our controls and procedures or failure to comply with regulations related to controls and procedures; (6) potential deterioration in real estate values; (7) the impact of competition with other financial institutions, including deposit and loan pricing pressures and the resulting impact, including as a result of compression to net interest margin; (8) risks relating to the ability to retain our culture and attract and retain qualified people, which could be exacerbated by the continuing work from remote environment; (9) credit risks associated with an obligor’s failure to meet the terms of any contract with the Bank or otherwise fail to perform as agreed under the terms of any loan-related document; (10) risks related to the ability of the Company to pursue its strategic plans which depend upon certain growth goals in our lines of business; (11) liquidity risk affecting the Bank’s ability to meet its obligations when they come due; (12) risks associated with an anticipated increase in SouthState’s investment securities portfolio, including risks associated with acquiring and holding investment securities or potentially determining that the amount of investment securities SouthState desires to acquire are not available on terms acceptable to SouthState; (13) unexpected outflows of uninsured deposits may require us to sell investment securities at a loss; (14) the loss of value of our investment portfolio could negatively impact market perceptions of us and could lead to deposit withdrawals; (15) price risk focusing on changes in market factors that may affect the value of traded instruments in “mark-to-market” portfolios; (16) transaction risk arising from problems with service or product delivery; (17) compliance risk involving risk to earnings or capital resulting from violations of or nonconformance with laws, rules, regulations, prescribed practices, or ethical standards; (18) regulatory change risk resulting from new laws, rules, regulations, accounting principles, proscribed practices or ethical standards, including, without limitation, the possibility that regulatory agencies may require higher levels of capital above the current regulatory-mandated minimums and including the impact of special FDIC assessments, the Consumer Financial Protection Bureau regulations or other guidance, and the possibility of changes in accounting standards, policies, principles and practices; (19) strategic risk resulting from adverse business decisions or improper implementation of business decisions; (20) reputation risk that adversely affects earnings or capital arising from negative public opinion including the effects of social media on market perceptions of us and banks generally; (21) cybersecurity risk related to the dependence of SouthState on internal computer systems and the technology of outside service providers, as well as the potential impacts of internal or external security breaches, which may subject the Company to potential business disruptions or financial losses resulting from deliberate attacks or unintentional events; (22) reputational and operational risks associated with environment, social and governance (ESG) matters, including the impact of recently passed state legislation and proposed federal and state regulatory guidance and regulation relating to climate change; (23) greater than expected noninterest expenses; (24) excessive loan losses; (25) reputational risk and possible higher than estimated reduced revenue from previously announced changes in the Bank’s consumer overdraft programs and other deposit products; (26) the risks of fluctuations in market prices for SouthState common stock that may or may not reflect economic condition or performance of SouthState; (27) the payment of dividends on SouthState common stock, which is subject to legal and regulatory limitations as well as the discretion of the board of directors of SouthState, SouthState’s performance and other factors; (28) ownership dilution risk associated with potential acquisitions in which SouthState’s stock may be issued as consideration for an acquired company; (29) operational, technological, cultural, regulatory, legal, credit and other risks associated with the exploration, consummation and integration of potential future acquisitions, whether involving stock or cash consideration; (30) catastrophic events such as hurricanes, tornados, earthquakes, floods or other natural or human disasters, including public health crises and infectious disease outbreaks, as well as any government actions in response to such events, and the related disruption to local, regional and global economic activity and financial markets, and the impact that any of the foregoing may have on SouthState and its customers and other constituencies; (31) geopolitical risk from terrorist activities and armed conflicts that may result in economic and supply disruptions, and loss of market and consumer confidence; and (32) other factors that may affect future results of SouthState, as disclosed in SouthState’s Annual Report on Form 10-K, Quarterly Reports on Form 10-Q, and Current Reports on Form 8-K, filed by SouthState with the U.S. Securities and Exchange Commission (“SEC”) and available on the SEC’s website at http://www.sec.gov, any of which could cause actual results to differ materially from future results expressed, implied or otherwise anticipated by such forward-looking statements. All forward-looking statements speak only as of the date they are made and are based on information available at that time. SouthState does not undertake any obligation to update or otherwise revise any forward-looking statements, whether as a result of new information, future events, or otherwise, except as required by federal securities laws. As forward-looking statements involve significant risks and uncertainties, caution should be exercised against placing undue reliance on such statements. |
| (1) Financial metrics as of December 31, 2023; market cap as of January 24, 2024 SouthState Corporation Overview of Franchise (1) (251) $37 Billion in deposits $32 Billion in loans $45 Billion in assets $6.3 Billion market cap Top 35 Forbes 100 Best Banks in America 2023 Ranked #2 by S&P Global 5 Greenwich Excellence & Best Brand Awards for Small Business Banking from Coalition Greenwich 3 |
| Local Market Leadership Our business model supports the unique character of the communities we serve and encourages decision making by the banker that is closest to the customer. Long-Term Horizon We think and act like owners and measure success over entire economic cycles. We prioritize soundness before short-term profitability and growth. Remarkable Experiences We will make our customers’ lives better by anticipating their needs and responding with a sense of urgency. Each of us has the freedom, authority and responsibility to do the right thing for our customers. Meaningful and Lasting Relationships We communicate with candor and transparency. The relationship is more valuable than the transaction. Greater Purpose We enable our team members to pursue their ultimate purpose in life—their personal faith, their family, their service to community. The WHAT The HOW Guiding Principles Core Values Leadership The WHY To invest in the entrepreneurial spirit, pursue excellence and inspire a greater purpose. 4 |
| 17.8% 13.7%12.8% 11.9% 8.9% 8.3% 6.0% FL SC GA NC VA U.S. AL Actual Population Growth 2010-2023 $1.9B $1.9B $0.8B $0.6B $2.9B $2.0B POSITIONED FOR THE FUTURE IN THE BEST GROWTH MARKETS IN AMERICA 5 $302 $325 $713 $773 $811 $1,595 AL SC VA NC GA FL GDP by State ($ in billions) 5.3% 4.7% 3.9% 3.7% 3.0% 3.0% 2.4% FL SC NC GA VA AL U.S. Projected Population Growth 2024-2029 $3.3 $3.7 $4.2 $4.4 $4.5 $17.7 $27.0 UK India Japan Germany SSB Footprint China US GDP ($ in trillions) The combined GDP of SouthState’s 6 state branch footprint would represent the world’s third largest economy. 1.2 0.3 0.4 0.4 0.3 0.2 8.1 Population increase (in millions) For end note descriptions, see Earnings Presentation End Notes starting on slide 45. Population increase (in millions) 3.3 0.6 1.2 1.1 0.7 25.8 0.3 $10.6B $12.0B $7.4B $10.9B $0.8B $0.6B $6.5B $6.2B $2.9B $2.0B Loans Deposits |
| Source: U.S. Census Bureau (Net Domestic Migration) PANDEMIC ACCELERATES POPULATION MIGRATION TO THE SOUTH Top 10 States Net Domestic Migration 1. Florida 818,762 2. Texas 656,220 3. North Carolina 310,189 4. South Carolina 248,055 5. Arizona 218,247 6. Tennessee 207,097 7. Georgia 185,752 8. Idaho 104,313 9. Alabama 96,538 10. Oklahoma 80,064 6 |
| INVESTMENT THESIS 7 • High growth markets • Granular, low-cost core deposit base • Diversified revenue streams • Strong credit quality and disciplined underwriting • Energetic and experienced management team with entrepreneurial ownership culture • True alternative to the largest banks with capital markets platform and upgraded technology solutions |
| Quarterly Results |
| HIGHLIGHTS | LINKED QUARTER Dollars in millions, except per share data (1) For end note descriptions, see Earnings Presentation End Notes starting on slide 45. 9 3Q23 4Q23 GAAP Net Income $ 124.1 $ 106.8 EPS (Diluted) $ 1.62 $ 1.39 Return on Average Assets 1.10 % 0.94 % Non-GAAP(1) Return on Average Tangible Common Equity 15.5 % 13.5 % Non-GAAP, Adjusted(1) Net Income $ 124.3 $ 128.3 EPS (Diluted) $ 1.62 $ 1.67 Return on Average Assets 1.10 % 1.13 % Return on Average Tangible Common Equity 15.5 % 16.1 % |
| QUARTERLY HIGHLIGHTS | 4Q 2023 (1)~(3) For end note descriptions, see Earnings Presentation End Notes starting on slide 45. 10 • Reported Diluted Earnings per Share (“EPS”) of $1.39; adjusted Diluted EPS (non-GAAP)(1) of $1.67 • Pre-Provision Net Revenue (“PPNR”)(non-GAAP)(2) of $173.9 million, or 1.53% PPNR ROAA (non-GAAP)(2) • PPNR per weighted average diluted share (non-GAAP)(2) of $2.27 • Loans increased $372 million, or 5% annualized, led by consumer real estate • Deposits increased $114 million, or 1% annualized, despite a $339 million decline in brokered CDs; excluding brokered CDs, deposits increased $453 million, or 5% annualized, from prior quarter • Total deposit cost of 1.60%, up 0.16% from prior quarter, resulting in a 30% cycle-to-date beta • Repurchased a total of 100,000 shares during 4Q 2023 at a weighted average price of $67.45 • Net interest margin, non-tax equivalent of 3.47% and tax equivalent (non-GAAP)(3) of 3.48% • Net charge-offs of $7.3 million, or 0.09% annualized; Provision for Credit Losses (“PCL”), including release for unfunded commitments, of $9.9 million; total allowance for credit losses (“ACL”) plus reserve for unfunded commitments of 1.58% • Recorded FDIC special assessment expense of $26 million • Efficiency ratio of 63% and adjusted efficiency ratio (non-GAAP)(1) of 57% |
| $388.6 $373.9 $356.2 $351.3 $350.4 $7.4 $7.4 $5.5 $4.1 $3.9 $396.0 $381.3 $361.7 $355.4 $354.2 3.99% 3.93% 3.62% 3.50% 3.48% 2.4% 2.8% 3.2% 3.6% 4.0% 4.4% $100 $150 $200 $250 $300 $350 $400 4Q22 1Q23 2Q23 3Q23 4Q23 $ in millions Net Interest Income excld. Accretion Accretion Net Interest Income Net Interest Margin NET INTEREST MARGIN (1) Dollars in millions; Amounts may not total due to rounding. (1)~(3) For end note descriptions, see Earnings Presentation End Notes starting on slide 45. 11 (2) (2) (3) |
| LOAN PRODUCTION VS LOAN GROWTH $1,256 $1,791 $1,933 $2,079 $1,699 $1,470 $1,535 $1,879 $1,834 $2,355 $2,636 $3,129 $2,582 $3,863 $3,372 $3,305 $2,181 $2,369 $1,459 $1,233 $180 $82 $267 $153 $180 $(372)$(277) $(155) $(185) $169 $573 $396 $381 $1,451 $933 $1,347 $519 $845 $480 $372 $(500) $— $500 $1,000 $1,500 $2,000 $2,500 $3,000 $3,500 $4,000 1Q19 2Q19 3Q19 4Q19 1Q20 2Q20 3Q20 4Q20 1Q21 2Q21 3Q21 4Q21 1Q22 2Q22 3Q22 4Q22 1Q23 2Q23 3Q23 4Q23 $ in millions Loan Production Loan Portfolio Growth Dollars in millions (1)~(4) For end note descriptions, see Earnings Presentation End Notes starting on slide 45. 12 (2) (4) (4) (4) (4) (4) (4) (3) (3) (1) (1) (1) (1) |
| Balance Sheet |
| 4Q22 1Q23 2Q23 3Q23 4Q23 DDA / Total Deposits 36% 34% 31% 30% 29% LOAN AND DEPOSIT TRENDS $30.2 $30.7 $31.5 $32.0 $32.4 $29.0B $29.5B $30.0B $30.5B $31.0B $31.5B $32.0B $32.5B $33.0B $— $6 $12 $18 $24 $30 $36 $42 4Q22 1Q23 2Q23 3Q23 4Q23 $ in billions Loans (1) Dollars in billions Amounts may not total due to rounding. (1) For end note descriptions, see Earnings Presentation End Notes starting on slide 45. 14 $13.2 $12.4 $11.5 $11.2 $10.6 $9.0 $8.3 $8.2 $7.8 $8.0 $11.8 $11.5 $12.6 $13.5 $14.2 $2.4 $4.1 $4.4 $4.5 $4.2 $- $50,000,000.0B $100,000,000.0B $150,000,000.0B $200,000,000.0B $250,000,000.0B $300,000,000.0B $350,000,000.0B $— $6 $12 $18 $24 $30 $36 $42 $ in billions Deposits Noninterest-bearing Checking ("DDA") Interest-bearing Checking MMA & Savings Time Deposits |
| Investor CRE (2) 28% Consumer RE 25% Owner-Occupied CRE 17% C&I 17% CDL (1) 9% Cons / Other 4% TOTAL LOAN PORTFOLIO 15 Data as of December 31, 2023 Loan portfolio balances, average balances or percentage exclude loans held for sale (1)~(3) For end note descriptions, see Earnings Presentation End Notes starting on slide 45. Loan Type No. of Loans Balance Avg. Loan Balance Investor CRE 8,216 $ 9.2B $ 1,123,200 Consumer RE 44,408 8.0B 180,000 Owner-Occupied CRE 7,816 5.5B 703,400 C & I 19,287 5.5B 285,400 Constr., Dev. & Land 3,622 2.9B 807,200 Cons / Other(3) 56,719 1.1B 19,300 Total(3) 140,068 $ 32.2B $ 230,200 Loan Relationships Top 10 Represents ~ 2% of total loans Top 20 Represents ~ 4% of total loans Loans by Type Total Loans $32.4 Billion • SNC loans represent approximately 2% of total outstanding loans at December 31, 2023 |
| 41% 31% 30% Checking Accounts Composition Commercial Small Business Retail Noninterest-bearing Checking $10.6B Interest-bearing Checking $8.0B Savings $2.6B Money Market $11.5B Time Deposits $4.2B Data as of December 31, 2023 Dollars in billions except for average checking balances; Amounts may not total due to rounding. † & (1) For end note descriptions, see Earnings Presentation End Notes starting on slide 45. 50% 45% 38% 38% 12% 17% —% 20% 40% 60% 80% 100% SSB Peer Average (1) Deposit Mix vs. Peers Checking Accounts MM & Savings Time Deposits PREMIUM CORE † DEPOSIT FRANCHISE 16 Total Deposits $37.0 Billion Deposits by Type Checking Type Avg. Checking Balance Commercial $301,000 Small Business $40,600 Retail $9,500 Total Cost of Deposits 4Q23 SSB 160 bps Peer Average(1) 224 bps |
| REMAIN WELL - POSITIONED DURING CURRENT CYCLE – PREVIOUS AND CURRENT RISING INTEREST RATE CYCLE Historic deposit beta excludes legacy ACBI. 17 0.11% 0.75% 2.17% 3.64% 4.50% 4.98% 5.25% 5.31% 0.05%0.05% 0.08% 0.21% 0.63% 1.11% 1.44% 1.60% —% 1.0% 2.0% 3.0% 4.0% 5.0% 6.0% 1Q22 2Q22 3Q22 4Q22 1Q23 2Q23 3Q23 4Q23 0.16% 0.37% 0.37% 0.40% 0.45% 0.70% 0.95% 1.16% 1.20% 1.45% 1.74% 1.92% 2.22% 2.40% 2.40% 0.12% 0.12% 0.11% 0.11% 0.12% 0.13% 0.15% 0.17% 0.19% 0.25% 0.34% 0.44% 0.52% 0.56% 0.64% —% 1.0% 2.0% 3.0% 4.0% 5.0% 6.0% 4Q15 1Q16 2Q16 3Q16 4Q16 1Q17 2Q17 3Q17 4Q17 1Q18 2Q18 3Q18 4Q18 1Q19 2Q19 24% deposit beta in previous cycle Average Fed Funds Rate Cost of Deposits 30% deposit beta in current cycle to date |
| Credit |
| Greenville Miami/Ft. Lauderdale Jacksonville Tamp a Charleston Atlanta LOAN PORTFOLIO – OFFICE EXPOSURE 19 State • Office represents 4% of the loan portfolio • Average loan size only $1.4 million • 96% located in the SouthState footprint • Approximately 10% is located within the Central Business District(1) • 82% of the portfolio is less than 150K square feet(1) • 91% mature in 2025 or later • 57% weighted average Loan to Value(2) • 1.66x weighted average Debt Service Coverage(2) Granular and Diversified Office Portfolio MSA (1)&(2) For end note descriptions, see Earnings Presentation End Notes starting on slide 45. FL 45% SC 22% GA 18% VA 5% Other 4% NC 4% AL 2% |
| LOAN PORTFOLIO – NON OWNER - OCCUPIED COMMERCIAL REAL ESTATE (1) Balance and average loan size in millions (1)~(3) For end note descriptions, see Earnings Presentation End Notes starting on slide 45. 20 Loan Type Balance Avg Loan Size Wtd Avg DSC(2) Wtd Avg LTV(2) AL% FL% GA% NC% SC% VA% OTHER % Non-Accrual %(3) Substandard & Accruing %(3) Special Mention %(3) Retail $2,104 $1.6 1.78 54% 2% 56% 15% 6% 11% 2% 7% 0.15% 0.38% 0.26% Office 1,264 1.4 1.66 57% 2% 45% 18% 4% 22% 5% 4% —% 7.59% 0.17% Warehouse / Industrial 1,139 1.5 1.73 58% 7% 41% 19% 6% 15% 6% 7% —% 0.17% 1.35% Hotel 954 4.6 1.91 57% 4% 19% 9% 14% 40% 10% 4% 0.01% 3.62% 0.89% Multifamily 923 1.9 1.51 55% 5% 25% 28% 8% 28% 1% 4% —% 3.90% 0.31% Medical 561 1.7 1.85 59% 0% 54% 10% 9% 12% 6% 9% 0.12% 0.81% 1.29% Other 488 1.4 1.48 59% 1% 33% 29% 13% 20% 2% 2% 0.05% 1.21% 6.96% Self Storage 434 3.4 1.68 55% 6% 42% 23% 4% 16% —% 8% —% 6.35% 3.46% Nursing Home 185 3.9 1.23 59% 1% 21% 27% 10% 23% 14% 5% 7.12% 39.99% —% |
| LOAN PORTFOLIO – COMMERCIAL REAL ESTATE MATURITIES BY YEAR (1) (1) For end note descriptions, see Earnings Presentation End Notes starting on slide 45. 21 $1.1 $1.0 $1.7 $1.7 $1.6 $7.7 7% 7% 12% 11% 11% 52% 0% 10% 20% 30% 40% 50% $— $1.0 $2.0 $3.0 $4.0 $5.0 $6.0 $7.0 $8.0 $9.0 2024 2025 2026 2027 2028 2029 & Beyond $ in billions 93% of CRE loans mature in 2025 or later |
| (1)&(2) For end note descriptions, see Earnings Presentation End Notes starting on slide 45. 74% 14% 11% 1% Consumer, Residential Mtg and HELOC Segment Mortgage(1) HELOCs Other Consumer CD-Secured LOAN PORTFOLIO – CONSUMER, RESIDENTIAL MORTGAGE AND HELOC Credit Indicator 3Q23 4Q23 HELOC MORTGAGE HELOC MORTGAGE Wtd. Avg. Credit Score of Originations 770 760 776 747 Wtd. Avq. Credit Score of Portfolio 769 764 774 763 Wtd. Avg. LTV(2) 61% 73% 60% 73% Wtd. Avg. DTI of Originations 31% 35% 33% 37% Utilization Rate 37% N/A 38% N/A 22 Credit Indicator 3Q23 4Q23 NPL Ratio (Non-Accruals & 90+ DPD & Accruing) 0.34% 0.38% Net Charge-Offs Ratio 0.02% 0.02% 30+ DPD Ratio (Accruing & Non-Accruing) 0.40% 0.44% 90+ DPD Ratio (Accruing and Non-Accruing) 0.13% 0.17% • 36%(1) of HELOCs are first mortgage |
| 0.36% 0.42% 0.54% 0.52% 0.57% —% 0.25% 0.50% 0.75% 1.00% 4Q22 1Q23 2Q23 3Q23 4Q23 Nonperforming Assets to Loans & OREO 1.61% 1.57% 1.86% 1.94% 2.56% 0.54% 0.55% 0.71% 0.63% 0.58% 1.07% 1.02% 1.15% 1.31% 1.97% —% 1.00% 2.00% 3.00% 4.00% 4Q22 1Q23 2Q23 3Q23 4Q23 Criticized & Classified Asset Trends Combined Special Mention / Assets Substandard / Assets ASSET QUALITY METRICS Dollars in millions 23 0.01% 0.01% 0.04% 0.16% 0.09% (0.05)% 0.05% 0.15% 0.25% 4Q22 1Q23 2Q23 3Q23 4Q23 Net Charge-Offs to Loans • $196 million in provision for credit losses vs. $29 million in net charge-offs trailing eight quarters • Increased ACL plus reserve for unfunded commitments by 18 bps to 1.58% from 4Q22 to 4Q23 |
| Dollars in millions (1) For end note descriptions, see Earnings Presentation End Notes starting on slide 45. LOSS ABSORPTION CAPACITY TREND 24 $(8.4) $19.3 $23.9 $47.1 $33.1 $38.4 $32.7 $9.9 $2.3 $2.3 $(1.3) $0.9 $1.0 $3.3 $13.2 $7.3 $(10) $- $10 $20 $30 $40 $50 1Q22 2Q22 3Q22 4Q22 1Q23 2Q23 3Q23 4Q23 $ in millions Provision for Credit Losses & Net Charge-Offs (Recoveries) Provision for Credit Losses Net Charge-Offs (Recoveries) $300 $320 $324 $356 $371 $427 $448 $457 $30 $33 $53 $67 $85 $63 $62 $56 1.25% 1.26% 1.31% 1.40% 1.48% 1.56% 1.59% 1.58% 1.00% 1.40% 1.80% 2.20% $150 $200 $250 $300 $350 $400 $450 $500 $550 1Q22 2Q22 3Q22 4Q22 1Q23 2Q23 3Q23 4Q23 $ in millions Total ACL(1) plus Reserve for Unfunded Commitments Total ACL Reserve for Unfunded Commitments % of Total Loans |
| Capital |
| CAPITAL RATIOS 3Q23 4Q23(2) Tangible Common Equity(1) 7.5 % 8.2 % Tier 1 Leverage 9.3 % 9.4 % Tier 1 Common Equity 11.5 % 11.8 % Tier 1 Risk-Based Capital 11.5 % 11.8 % Total Risk-Based Capital 13.8 % 14.1 % Bank CRE Concentration Ratio 240 % 237 % Bank CDL Concentration Ratio 58 % 60 % (1)&(2) For end note descriptions, see Earnings Presentation End Notes starting on slide 45. 26 |
| 14.08% 12.50% —% 4.00% 8.00% 12.00% 16.00% As Reported With AOCI Impact Total Risk-based Capital Ratio 10.00% 8.00% 9.42% 8.30% —% 4.00% 8.00% 12.00% 16.00% As Reported With AOCI Impact Tier 1 Leverage Ratio 5.00% 4.00% 11.75% 10.16% —% 4.00% 8.00% 12.00% 16.00% As Reported With AOCI Impact CET 1 Risk-based Capital Ratio 6.50% 4.50% WELL CAPITALIZED INCLUDING AOCI IMPACT As Reported capital ratios are preliminary. (1) For end note descriptions, see Earnings Presentation End Notes starting on slide 45. 27 8.21% 8.21% —% 4.00% 8.00% 12.00% 16.00% As Reported With AOCI Impact TCE Ratio(1) Minimum Capital Ratio Well Capitalized Minimum |
| Appendix |
| Dollars in millions, expect for average deposit size per account (1)~(3) For end note descriptions, see Earnings Presentation End Notes starting on slide 45. STABLE FUNDING BASE AND STRONG LIQUIDITY POSITION 29 • 1.4 million accounts, with an average deposit size of approximately $27,000, which is the lowest in our peer group • Top 10 and 20 deposit relationships represent 3% and 4%, respectively, of total deposits(3) • Uninsured deposits are 38% of total deposits; uninsured and uncollateralized deposits represent 32% of total deposits(2) Primary Contingency Funding Sources at December 31, 2023 (in millions) Total Available Amount Used Net Availability Cash and Cash Equivalents $ 999 $ — $ 999 Federal Home Loan Bank of Atlanta 7,089 103 6,986 Federal Reserve Discount Window 1,882 — 1,882 Brokered Deposits(1) 5,557 720 4,837 Unpledged Securities, at Par 3,638 — 3,638 Total Primary Liquidity Sources $ 19,165 $ 823 $ 18,342 Uninsured and Uncollateralized Deposits(2) 11,814 Coverage Ratio Uninsured and Uncollateralized Deposits 155% |
| 44% 30% 21% 4% Municipal Bond Rating 1% AAA AA+ AA AA-A+ Dollars in billions, unless otherwise noted; data as of December 31, 2023 Amounts may not total due to rounding. † , (1)~(4) For end note descriptions, see Earnings Presentation End Notes starting on slide 45. 2.29% 2.37% 2.35% 2.36% 2.45% 1.00% 1.30% 1.60% 1.90% 2.20% 2.50% 4Q22 1Q23 2Q23 3Q23 4Q23 Investment Securities Yield(2) HIGH QUALITY INVESTMENT PORTFOLIO 74% 13% 13% 0.4% Investment Portfolio† Composition Agency MBS(1) Treasury, Agency & SBA Municipal Corporates Type AFS HTM Balance Duration (yrs)(3,4) Balance Duration (yrs)(4) Agency MBS(1) $3.1B 5.2 $2.2B 6.0 Municipal $1.0B 8.6 — — Treasury, Agency & SBA $0.7B 3.3 $0.3B 5.4 Corporates $0.03B 2.5 — — Total $4.8B 5.6 $2.5B 5.9 30 Total Investment Portfolio† $7.3 Billion • 95% of municipal portfolio is AA or higher rated • ~$330 million in documented ESG investments and ~$165 million CRA eligible investments(4) |
| CURRENT & HISTORICAL 5 - QTR PERFORMANCE (1) 86% 84% 82% 83% 84% 14% 16% 18% 17% 16% $462M $453M $440M $429M $420M 4.44% 2.5% 3.0% 3.5% 4.0% 4.5% 5.0% 0% 20% 40% 60% 80% 100% 4Q22 1Q23 2Q23 3Q23 4Q23 Revenue Composition NIM, TE / Revenue Noninterest Income / Revenue Avg. 10-year UST Total Revenue Dollars in millions (1)&(2) For end note descriptions, see Earnings Presentation End Notes starting on slide 45. $63 $71 $77 $73 $65 0.57% 0.66% 0.69% 0.64% 0.58% 0.5% 0.6% 0.7% 0.8% 0.9% 1.0% $— $20 $40 $60 $80 $100 $120 $140 4Q22 1Q23 2Q23 3Q23 4Q23 $ in millions Noninterest Income Noninterest Income Noninterest Income / Avg. Assets $398 $382 $362 $356 $355 3.99% 3.93% 3.62% 3.50% 3.48% 2.0% 2.5% 3.0% 3.5% 4.0% 4.5% $200 $300 $400 4Q22 1Q23 2Q23 3Q23 4Q23 $ in millions Net Interest Margin (“NIM”, TE) NIM, TE ($) NIM, TE (%) 48% 51% 54% 54% 63% 48% 49% 53% 54% 57% —% 15% 30% 45% 60% 75% 90% 4Q22 1Q23 2Q23 3Q23 4Q23 Efficiency Ratio Efficiency Ratio Adjusted Efficiency Ratio 31 (2) |
| QTD Production ($mm) $693 $521 $436 Refinance 6% 6% 5% Purchase 94% 94% 95% 51% 49% 4Q23 MORTGAGE BANKING DIVISION (1) For end note descriptions, see Earnings Presentation End Notes starting on slide 45. 32 Highlights Quarterly Mortgage Production Gain on Sale Margin • Mortgage banking income of $2.2 million in 4Q 2023 compared to $2.5 million in 3Q 2023 • Secondary pipeline of $64 million at 4Q 2023, as compared to $92 million at 3Q 2023 1.36% 2.33% 2.00% 1.84% 1.59% 4Q22 1Q23 2Q23 3Q23 4Q23 Mortgage Banking Income ($mm) 81% 19% 4Q22 Portfolio Secondary 53% 47% 3Q23 4Q22 3Q23 4Q23 Secondary Market Gain on Sale, net $ 460 $ 1,878 $ 889 Fair Value Change(1) 317 (570) 312 Total Secondary Market Mortgage Income $ 777 $ 1,308 $ 1,201 MSR Servicing Fee Income $ 4,160 $ 4,120 $ 4,127 Fair Value Change / Decay (5,482) (2,950) (3,136) Total MSR-Related Income $ (1,322) $ 1,170 $ 991 Total Mortgage Banking Income $ (545) $ 2,478 $ 2,192 |
| Cumulative Consumer R/E Loan Growth ($) $(12) $(98) $(264) $(486) $(625) $(712) $(727) $(653) $(535) $(18) $454 $952 $1,337 $1,752 $2,085 $2,470 ($300) ($150) $0 $150 $300 $450 $600 $(12) $(86) $(167) $(221) $(139) $(87) $(15) $73 $119 $517 $472 $498 $386 $415 $333 $385 3.63% 3.46% 3.25%3.04% 3.08% 3.00% 3.04% 3.25% 4.25% 5.54% 6.21% 7.08% 6.38% 6.75% 7.50% 6.50% 3.07% 4.49% 4.11% 4.56% 4.33% 2.85% 3.13% 2.83% 2.87% 2.13%2.16% 1.36% 2.33% 2.00%1.84%1.59% -% 2.0% 4.0% 6.0% 8.0% $(300) $(100) $100 $300 $500 $700 1Q20 2Q20 3Q20 4Q20 1Q21 2Q21 3Q21 4Q21 1Q22 2Q22 3Q22 4Q22 1Q23 2Q23 3Q23 4Q23 $ in millions Consumer R/E Loan Growth ($) 30-yr Fixed Mortgage Rate GOS Margin RESIDENTIAL MORTGAGE PORTFOLIO GAIN ON SALE (“GOS”) MARGIN AND INTEREST RATES Dollars in millions (1) & (2) For end note descriptions, see Earnings Presentation End Notes starting on slide 45. 33 (1)(2) (2) |
| $(8.5) $(8.4) $(8.5) $(11.9) $(12.7) $16.8 $22.0 $27.7 $24.8 $16.1 ($10.0) ($5.0) $0.0 $5.0 $10.0 $15.0 $20.0 $25.0 $30.0 $35.0 $(15) $(10) $(5) $— $5 $10 $15 $20 $25 $30 $35 4Q22 1Q23 2Q23 3Q23 4Q23 $ in millions Correspondent Revenue Breakout ARC Revenues, gross Interest on VM FI Revenues Operational Revenues Total Revenues, gross • Provides capital markets hedging (ARC), fixed income sales, international, clearing and other services to over 1,200 financial institutions across the country CORRESPONDENT BANKING DIVISION 34 1,208 Financial Institution Clients (1) For end note descriptions, see Earnings Presentation End Notes starting on slide 45. Correspondent banking and capital markets income, gross $ 16,760 $ 21,956 $ 27,734 $ 24,808 $ 16,081 Interest on centrally-cleared Variation Margin ("VM")(1) (8,451) (8,362) (8,547) (11,892) (12,677) Total Correspondent Banking and Capital Markets Income $ 8,309 $ 13,594 $ 19,187 $ 12,916 $ 3,404 |
| DIGITAL TRENDS 35 65% 64% 35% 36% —% 20% 40% 60% 80% 100% 4Q22 4Q23 Branch Digital Digital Deposits* $90M $134M $— $20 $40 $60 $80 $100 $120 $140 4Q22 4Q23 Millions Zelle P2P Transactions Digital Sales – Deposit Accounts * Digital Sales – Loans ** 79% 76% 21% 24% —% 20% 40% 60% 80% 100% 4Q22 4Q23 Branch Digital 84% 83% 16% 17% —% 20% 40% 60% 80% 100% 4Q22 4Q23 Branch Digital 409,276 416,587 — 50,000 100,000 150,000 200,000 250,000 300,000 350,000 400,000 450,000 4Q22 4Q23 Mobile App Users 39,076 37,848 — 5,000 10,000 15,000 20,000 25,000 30,000 35,000 40,000 45,000 50,000 4Q22 4Q23 Secure Messages & Chat 2% Increase 49% Increase 3% Decrease * Consumer DDA and Savings ** Consumer Loans |
| BRANCH OPTIMIZATION 85 Branches Average Size $40M 422 Branches Acquired Plus 12 DeNovo Branches 268 Branches Consolidated or Sold 251 Branches Average Size $148M Increased deposits per branch 3.7x from 2009 to 4Q23 85 434 268 251 2009 …..……………..………..……....…………………………….. 4Q 2023 36 |
| NON - GAAP RECONCILIATIONS – RETURN ON AVG. TANGIBLE COMMON EQUITY & PPNR RETURN ON AVG. ASSETS Dollars in thousands The tangible measures are non-GAAP measures and exclude the effect of period end or average balance of intangible assets; the tangible returns on equity and common equity measures also add back the after-tax amortization of intangibles to GAAP basis net income. 37 Return on Average Tangible Equity 3Q23 4Q23 Net income (GAAP) $ 124,144 $ 106,791 Plus: Amortization of intangibles 6,616 6,615 Effective tax rate, excluding DTA write-off 21 % 22 % Amortization of intangibles, net of tax 5,221 5,172 Net income plus after-tax amortization of intangibles (non-GAAP) $ 129,365 $ 111,963 Average shareholders' common equity $ 5,328,912 $ 5,299,891 Less: Average intangible assets 2,022,810 2,015,719 Average tangible common equity $ 3,306,102 $ 3,284,172 Return on Average Tangible Common Equity (Non-GAAP) 15.5% 13.5% PPNR Return on Average Assets 3Q23 4Q23 PPNR, Adjusted (Non-GAAP) $ 190,177 $ 173,948 Average assets 44,841,319 45,037,632 PPNR ROAA 1.68% 1.53% |
| NON - GAAP RECONCILIATIONS – ADJUSTED NET INCOME & ADJUSTED EARNINGS PER SHARE (“EPS”) Dollars in thousands, except for per share data 38 Adjusted Net Income 3Q23 4Q23 Net income (GAAP) $ 124,144 $ 106,791 Plus: Securities losses, net of tax — 2 Merger, branch consolidation and severance related expense, net of tax 130 1,391 FDIC special assessment, net of tax — 20,087 Adjusted Net Income (Non-GAAP) $ 124,274 $ 128,271 Adjusted EPS 3Q23 4Q23 Diluted weighted-average common shares 76,571 76,634 Adjusted net income (non-GAAP) $ 124,274 $ 128,271 Adjusted EPS, Diluted (Non-GAAP) $ 1.62 $ 1.67 |
| NON - GAAP RECONCILIATIONS – ADJUSTED RETURN ON AVG. ASSETS & AVG. TANGIBLE COMMON EQUITY Dollars in thousands The tangible measures are non-GAAP measures and exclude the effect of period end or average balance of intangible assets; the tangible returns on equity and common equity measures also add back the after-tax amortization of intangibles to GAAP basis net income. 39 Dollars in thousands, except for per share data Adjusted Return on Average Assets 3Q23 4Q23 Adjusted net income (non-GAAP) $ 124,274 $ 128,271 Total average assets 44,841,319 45,037,632 Adjusted Return on Average Assets (Non-GAAP) 1.10% 1.13% Adjusted Return on Average Tangible Common Equity 3Q23 4Q23 Adjusted net income (non-GAAP) $ 124,274 $ 128,271 Plus: Amortization of intangibles, net of tax 5,221 5,172 Adjusted net income plus after-tax amortization of intangibles (non-GAAP) $ 129,495 $ 133,443 Average tangible common equity $ 3,306,102 $ 3,284,172 Adjusted Return on Average Tangible Common Equity (Non-GAAP) 15.54% 16.12% |
| NON - GAAP RECONCILIATIONS – NET INTEREST MARGIN & CORE NET INTEREST INCOME (EXCLD. FMV & PPP ACCRETION) Dollars in thousands 40 Dollars in thousands, except for per share data Net Interest Margin - Tax Equivalent (Non-GAAP) 4Q22 1Q23 2Q23 3Q23 4Q23 Net interest income (GAAP) $ 396,004 $ 381,263 $ 361,743 $ 355,371 $ 354,231 Tax equivalent adjustments 2,397 1,020 698 646 659 Net interest income (tax equivalent) (Non-GAAP) $ 398,401 $ 382,283 $ 362,441 $ 356,017 $ 354,890 Average interest earning assets $ 39,655,736 $ 39,409,340 $ 40,127,836 $ 40,376,380 $ 40,465,377 Net Interest Margin - Tax Equivalent (Non-GAAP) 3.99% 3.93% 3.62% 3.50% 3.48% Core Net Interest Margin excluding FMV Accretion (Non-GAAP) 4Q22 1Q23 2Q23 3Q23 4Q23 Net interest income (GAAP) $ 396,004 $ 381,263 $ 361,743 $ 355,371 $ 354,231 Less: Total accretion on acquired loans 7,350 7,398 5,481 4,053 3,870 Core Net Interest Margin excluding FMV Accretion (Non-GAAP) $ 388,654 $ 373,865 $ 356,262 $ 351,318 $ 350,361 |
| NON - GAAP RECONCILIATIONS – PPNR, ADJUSTED, PPNR/WEIGHTED AVG. CS & CORRESPONDENT & CAPITAL MARKETS INCOME (UNAUDITED) Dollars and weighted average commons share outstanding in thousands except per share data 41 4Q22 1Q23 2Q23 3Q23 4Q23 SSB SSB SSB SSB SSB Net interest income (GAAP) $ 396,004 $ 381,263 $ 361,743 $ 355,371 $ 354,231 Plus: Noninterest income 63,392 71,355 77,214 72,848 65,489 Less: Gains (losses) on sales of securities — 45 — — (2) Total revenue, adjusted (non-GAAP) $ 459,396 $ 452,573 $ 438,957 $ 428,219 $ 419,722 Less: Noninterest expense 229,499 240,505 242,626 238,206 273,243 PPNR (Non-GAAP) $ 229,897 $ 212,068 $ 196,331 $ 190,013 $ 146,479 Plus: Merger, branch consolidation and severance related expense 1,542 9,412 1,808 164 1,778 FDIC Special Assessment — — — — 25,691 Total adjustments $ 1,542 $ 9,412 $ 1,808 $ 164 $ 27,469 PPNR, Adjusted (Non-GAAP) $ 231,439 $ 221,480 $ 198,139 $ 190,177 $ 173,948 Weighted average common shares outstanding, diluted 76,327 76,389 76,418 76,571 76,634 PPNR, Adjusted per Weighted Avg. Common Shares Outstanding, Diluted (Non-GAAP) $ 3.03 $ 2.90 $ 2.59 $ 2.48 $ 2.27 Correspondent & Capital Markets Income 4Q22 1Q23 2Q23 3Q23 4Q23 SSB SSB SSB SSB SSB ARC revenues $ (1,083) $ 3,684 $ 11,126 $ 4,546 $ (6,058) FI revenues 6,238 6,916 5,055 5,692 6,447 Operational revenues 3,154 2,994 3,006 2,678 3,015 Total Correspondent & Capital Markets Income $ 8,309 $ 13,594 $ 19,187 $ 12,916 $ 3,404 PPNR, Adjusted & PPNR, Adjusted per Weighted Avg. Common Shares Oustanding, Diluted |
| NON - GAAP RECONCILIATIONS – CURRENT & HISTORICAL: EFFICIENCY RATIOS (UNAUDITED) Dollars in thousands 42 4Q22 1Q23 2Q23 3Q23 4Q23 Noninterest expense (GAAP) $ 229,499 $ 240,505 $ 242,626 $ 238,206 $ 273,243 Less: Amortization of intangible assets 8,027 7,299 7,028 6,616 6,615 Adjusted noninterest expense (non-GAAP) $ 221,472 $ 233,206 $ 235,598 $ 231,590 $ 266,628 Net interest income (GAAP) $ 396,004 $ 381,263 $ 361,743 $ 355,371 $ 354,231 Tax Equivalent ("TE") adjustments 2,397 1,020 698 646 659 Net interest income, TE (non-GAAP) $ 398,401 $ 382,283 $ 362,441 $ 356,017 $ 354,890 Noninterest income (GAAP) $ 63,392 $ 71,355 $ 77,214 $ 72,848 $ 65,489 Less: Gains/(losses) on sales of securities — 45 — — (2) Adjusted noninterest income (non-GAAP) $ 63,392 $ 71,310 $ 77,214 $ 72,848 $ 65,491 Efficiency Ratio (Non-GAAP) 48% 51% 54% 54% 63% Noninterest expense (GAAP) $ 229,499 $ 240,505 $ 242,626 $ 238,206 $ 273,243 Less: Merger, branch consolidation and severance related expense 1,542 9,412 1,808 164 1,778 FDIC Special Assessment — — — — 25,691 Amortization of intangible assets 8,027 7,299 7,028 6,616 6,615 Total adjustments $ 9,569 $ 16,711 $ 8,836 $ 6,780 $ 34,084 Adjusted noninterest expense (non-GAAP) $ 219,930 $ 223,794 $ 233,790 $ 231,426 $ 239,159 Adjusted Efficiency Ratio (Non-GAAP) 48% 49% 53% 54% 57% |
| NON - GAAP RECONCILIATIONS – TANGIBLE COMMON EQUITY RATIO Dollars in thousands 43 Tangible Common Equity ("TCE") Ratio 3Q23 4Q23 Tangible common equity (non-GAAP) $ 3,212,787 $ 3,521,216 Total assets (GAAP) 44,989,128 44,902,024 Less: Intangible assets 2,018,200 2,011,882 Tangible asset (non-GAAP) $ 42,970,928 $ 42,890,142 TCE Ratio (Non-GAAP) 7.5% 8.2% |
| NON - GAAP RECONCILIATIONS – CAPITAL RATIOS WITH AOCI IMPACT Dollars in thousands Tier 1 Leverage, CET 1 Risk-based Capital and Total Risk-based Capital Ratios as of December 31, 2023 are preliminary. 44 December 31, 2023 Tier 1 capital $ 4,159 Average Assets for leverage purposes 44,132 Tier 1 Leverage Ratio 9.42% Tier 1 capital 4,159 Plus: AOCI impact, net of tax (583) Adjusted Tier 1 capital with AOCI impact 3,576 Average assets for leverage purposes 44,132 Plus: Unrealized losses (currently excluded from leverage assets) (1,051) Adjusted average assets for leverage purposes 43,081 Tier 1 Leverage Ratio with AOCI Impact (non-GAAP) 8.30% Tier 1 Leverage Ratio with AOCI Impact (non-GAAP) December 31, 2023 CET 1 $ 4,159 Risk-weighted assets 35,385 CET 1 Risk-based Capital Ratio 11.75% CET 1 4,159 Plus: AOCI impact, net of tax (583) Adjusted CET 1 with AOCI impact 3,576 Risk-weighted assets 35,385 Plus: Adjustments for risk-weighted assets (174) Adjusted risk-weighted assets 35,211 CET 1 Risk-based Capital Ratio with AOCI Impact (non-GAAP) 10.16% CET 1 Risk-based Capital Ratio with AOCI Impact (non-GAAP) December 31, 2023 Total Risk-based Capital $ 4,983 Risk-weighted Assets 35,385 Total Risk-based Capital Ratio 14.08% Total Risk-based Capital 4,983 Plus: AOCI impact, net of tax (583) Adjusted total risk-based capital with AOCI impact 4,400 Risk-weighted assets 35,385 Plus: Adjustments for risk-weighted assets (174) Adjusted risk-weighted assets 35,211 Total Risk-based Capital Ratio with AOCI Impact (non-GAAP) 12.50% Total Risk-based Capital Ratio with AOCI Impact (non-GAAP) |
| EARNINGS PRESENTATION END NOTES 45 Slide 5 End Notes • Loans and deposits as of December 31, 2023; excludes $2.2B of loans and $3.4B of deposits from national lines of business and brokered deposits. • Country GDP as of 2023; State GDP as of 3Q23 • Sources: S&P Global, International Monetary Fund, US Bureau of Economic Analysis Slide 9 End Notes (1) The tangible measures are non-GAAP measures and exclude the effect of period end or average balance of intangible assets. The tangible returns on equity and common equity measures also add back the after-tax amortization of intangibles to GAAP basis net income; other adjusted figures presented are also Non-GAAP financial measures that exclude the impact of FDIC special assessment and merger, branch consolidation and severance related expenses - See reconciliation of GAAP to Non-GAAP measures in Appendix. Slide 10 End Notes (1) Adjusted figures exclude the impact of FDIC special assessment and merger, branch consolidation and severance related expenses; Core net interest income excluding loan accretion and net deferred fees on PPP is also a non-GAAP financial measure; Adjusted efficiency ratio is calculated by taking the noninterest expense excluding FDIC special assessment and merger, branch consolidation and severance related expenses and amortization of intangible assets - See reconciliation of GAAP to Non-GAAP measures in Appendix. (2) Adjusted PPNR, PPNR ROAA and PPNR per weighted average diluted share are Non-GAAP financial measures that exclude the impact of FDIC special assessment and merger, branch consolidation and severance related expenses - See reconciliation of GAAP to Non-GAAP measures in Appendix. (3) Tax equivalent NIM is a Non-GAAP financial measure - See reconciliation of GAAP to Non-GAAP measures in Appendix. Slide 11 End Notes (1) Tax equivalent NIM is a Non-GAAP financial measure - See reconciliation of GAAP to Non-GAAP measures in Appendix. (2) Accretion includes PPP loans deferred fees and loan discount accretion. (3) Tax equivalent Slide 12 End Notes (1) 1Q22, 2Q22 and 3Q22 loan production excludes production by legacy ACBI from March ~ July 2022 (pre-core system conversion); 1Q22 loan portfolio growth excludes acquisition date loan balances acquired from ACBI. (2) 1Q19 loan production excludes production from National Bank of Commerce (“NBC”); National Commerce Corporation, the holding company of NBC, was acquired by CenterState in 2Q19. (3) Excludes loans held for sale and PPP; loan production indicates committed balance total; loan portfolio growth indicates quarter-over-quarter loan ending balance growth, excluding loans held for sale and PPP. (4) The combined historical information referred to in this presentation as the “Combined Business Basis” is based on the reported GAAP results of the Company and CenterState for the applicable periods without adjustments and the information included in this release has not been prepared in accordance with Article 11 of Regulation S-X, and therefore does not reflect any of the pro forma adjustments that would be required thereby. All Combined Business Basis financial information should be reviewed in connection with the historical information of the Company and CenterState, as applicable. The combined historical information excludes ACBI. Slide 14 End Notes (1) Excludes loans held for sale and PPP loans. |
| EARNINGS PRESENTATION END NOTES 46 Slide 15 End Notes (1) CDL includes residential construction, commercial construction, and all land development loans. (2) Investor CRE includes nonowner-occupied CRE and other income producing property. (3) Excludes SELF loans acquired from ACBI. Slide 16 End Notes † Core deposits defined as non-time deposits (1) Source: S&P Global Market Intelligence; 4Q23 MRQs available as of January 24, 2023; Peers as disclosed in the most recent SSB proxy statement. Slide 19 End Notes (1) Review consists of all loans over $1 million; Substantially all loans reviewed in the $1 million to $1.5 million population were 50 thousand square feet or smaller and were not located in a Central Business District. (2) Weighted average DSC information from the Company’s December 31, 2022 stress test using commitment balances, totaling approximately $6 billion; excludes loans below $1.5 million, unless part of a larger relationship; Weighted average LTV as of December 31 Slide 20 End Notes (1) Includes loan types representing 2% or more of investor CRE portfolio; based on the total portfolio of $8.6 billion, excluding 1-4 family rental properties and agricultural loans. (2) Weighted average DSC information from the Company’s December 31, 2022 stress test using commitment balances, totaling approximately $6 billion; excludes loans below $1.5 million, unless part of a larger relationship; Weighted average LTV as of December 31 (3) Represents % of each loan type balance. Slide 21 End Notes (1) Includes agricultural and 1-4 family rental properties loans. Slide 22 End Notes (1) By net book balance (2) LTV calculated using most recent appraisal and based on loan amount Slide 24 End Notes (1) Unamortized discount on acquired loans was $51 million, $55 million, $59 million, $65 million, and $72 million for the quarters ended December 31, 2023, September 30, 2023, June 30, 2023, March 31, 2023, and December 31, 2022, respectively. Slide 26 End Notes (1) The tangible measures are non-GAAP measures and exclude the effect of period end intangible assets - See reconciliation of GAAP to Non-GAAP measures in Appendix. (2) Preliminary |
| EARNINGS PRESENTATION END NOTES 47 Slide 27 End Notes (1) The tangible measures are non-GAAP measures and exclude the effect of period end intangible assets - See reconciliation of GAAP to Non-GAAP measures in Appendix. • AOCI represents accumulated other comprehensive income. • As permitted, SouthState elected to exclude AOCI related to both available for sale (“AFS”) securities and benefit plans from Tier 1, Common Equity Tier 1 (“CET 1”) and Total Risk-based Capital. Tier 1, CET 1 and Total Risk-based Capital ratios with AOCI Impact are non-GAAP measures that include the effect of unrealized losses for AFS securities, tax effected at 24.91%, as of December 31, 2023 in Tier 1, CET 1 and Total Risk-based Capital, average assets for leverage purposes and risk-weighted assets. See non-GAAP reconciliations in the Appendix. Slide 29 End Notes (1) Internal policy limit: 15% of total deposits (2) Uninsured/uncollateralized amounts are estimates and are based on the same methodologies and assumptions used for the Bank’s regulatory reporting requirements by the FDIC for the Call Report. (3) Percentages using month-to-date average balance of top relationships over quarter-to-date average total deposits as of December 31, 2023 Slide 30 End Notes † Investment portfolio excludes non-marketable equity. (1) MBS issued by U.S. government agencies or sponsored enterprises (commercial and residential collateral) (2) Investment securities yield include non-marketable equity and trading securities. (3) Excludes principal receivable balance as of December 31, 2023. (4) Based on current par value Slide 31 End Notes (1) Total revenue and noninterest income are adjusted by gains or losses on sales of securities and tax equivalent adjustments; Tax equivalent NIM, efficiency ratio and adjusted efficiency ratio are Non-GAAP financial measures; Adjusted Efficiency Ratio excludes the impact of FDIC special assessment and merger, branch consolidation and severance related expenses, gain on sales of securities, and amortization expense on intangible assets, as applicable – See Current & Historical Efficiency Ratios and Net Interest Margin reconciliation in Appendix. (2) Annualized Slide 32 End Notes (1) Includes pipeline, LHFS and MBS forwards. Slide 33 End Notes (1) The combined historical information referred to in this presentation as the “Combined Business Basis” is based on the reported GAAP results of the Company and CenterState for the applicable periods without adjustments and the information included in this release has not been prepared in accordance with Article 11 of Regulation S-X, and therefore does not reflect any of the pro forma adjustments that would be required thereby. All Combined Business Basis financial information should be reviewed in connection with the historical information of the Company and CenterState, as applicable. The combined historical information excludes ACBI. (2) As a result of the conversion of legacy CenterState’s core system to the Company’s core system completed in 2Q21, several loans were reclassified to conform with the Company’s loan segmentation, most notably residential investment loans which were reclassed from consumer R/E to investor commercial real estate category. Consumer R/E loans as of 1Q20, therefore, were reported based on the pre-reclassification figures. The Company estimated re-classifications for the 2Q20 from 1Q20 and for the 1Q20 from 4Q19 growth percentages for the comparison purposes. Slide 34 End Notes (1) Interest on centrally-cleared variation margin (expense or income) is included in ARC revenue within Correspondent Banking and Capital Markets Income. |
|
Document and Entity Information |
Jan. 25, 2024 |
|---|---|
| Cover [Abstract] | |
| Document Type | 8-K |
| Document Period End Date | Jan. 25, 2024 |
| Entity File Number | 001-12669 |
| Entity Registrant Name | SOUTHSTATE CORP |
| Entity Incorporation, State or Country Code | SC |
| Entity Tax Identification Number | 57-0799315 |
| Entity Address, Address Line One | 1101 First Street South |
| Entity Address, Adress Line Two | Suite 202 |
| Entity Address, City or Town | Winter Haven |
| Entity Address, State or Province | FL |
| Entity Address, Postal Zip Code | 33880 |
| City Area Code | 863 |
| Local Phone Number | 293-4710 |
| Written Communications | false |
| Soliciting Material | false |
| Pre-commencement Tender Offer | false |
| Pre-commencement Issuer Tender Offer | false |
| Title of 12(b) Security | Common stock, par value $2.50 per share |
| Trading Symbol | SSB |
| Security Exchange Name | NASDAQ |
| Entity Emerging Growth Company | false |
| Entity Central Index Key | 0000764038 |
| Amendment Flag | false |
1 Year SouthState Chart |
1 Month SouthState Chart |

It looks like you are not logged in. Click the button below to log in and keep track of your recent history.
Support: +44 (0) 203 8794 460 | support@advfn.com
By accessing the services available at ADVFN you are agreeing to be bound by ADVFN's Terms & Conditions
 Hot Features