ADVFN Logo ADVFN

We could not find any results for:
Make sure your spelling is correct or try broadening your search.

Trending Now

Toplists

It looks like you aren't logged in.
Click the button below to log in and view your recent history.

Hot Features

Registration Strip Icon for charts Register for streaming realtime charts, analysis tools, and prices.

OTIV On Track Innovations Ltd

0.17
0.00 (0.00%)
Last Updated: 01:00:00
Delayed by 15 minutes
Share Name Share Symbol Market Type
On Track Innovations Ltd NASDAQ:OTIV NASDAQ Common Stock
  Price Change % Change Share Price Bid Price Offer Price High Price Low Price Open Price Shares Traded Last Trade
  0.00 0.00% 0.17 0.1701 0.18 0 01:00:00

/C O R R E C T I O N -- On Track Innovations Ltd./

06/03/2008 4:49pm

PR Newswire (US)


On Track Innovations (NASDAQ:OTIV)
Historical Stock Chart


From Jul 2019 to Jul 2024
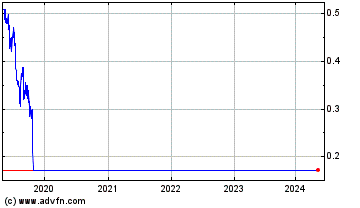
Click Here for more On Track Innovations Charts.
In the news release, OTI (NASDAQ:OTIV) Reports FY 2007 Fourth Quarter and Full Year Financial Results, in the CONDENSED CONSOLIDATED STATEMENT OF OPERATIONS table, the line "Amortization of intangible assets," the numbers in the third and fourth column were inverted, as incorrectly transmitted by PR Newswire. The corrected table follows: ON TRACK INNOVATIONS LTD CONDENSED CONSOLIDATED STATEMENT OF OPERATIONS (In thousands, except share and per share data) Year ended Three months ended December 31 December 31 2006 2007 2006 2007 Revenues Sales $35,171 $40,854 $10,417 $12,237 Licensing and transaction fees 5,382 2,631 2,775 779 Total revenues 40,553 43,485 13,192 13,016 Cost of Revenues Cost of sales 21,871 25,918 6,911 7,451 Total cost of revenues 21,871 25,918 6,911 7,451 Gross profit 18,682 17,567 6,281 5,565 Operating Expenses Research and development, net 7,065 12,265 1,811 4,062 Selling and marketing 7,072 9,670 1,952 2,812 General and administrative 11,948 17,593 2,771 4,149 Amortization of intangible assets 821 1,314 264 328 Gain from sale of subsidiaries (122) - - - Total operating expenses 26,784 40,842 6,798 11,351 Operating loss (8,102) (23,275) (517) (5,786) Financial income, net 1,712 1,862 434 390 Other expenses, net (75) (136) (95) (25) Loss before taxes on income and minority interests (6,465) (21,549) (178) (5,421) Income tax benefit 323 226 9 29 Minority shares in loss 625 1.038 32 - of subsidiary Equity in loss of affiliate (1,087) (358) (118) (86) Net loss $(6,604) $(20,643) $(255) $(5,478) Basic and diluted net loss per ordinary share from: Net loss $(0.47) $(1.09) $(0.02) $(0.29) Weighted average number of ordinary shares used in computing basic and diluted net loss per ordinary share 13,919,958 18,896,214 15,309,225 19,220,122 DATASOURCE: On Track Innovations Ltd.

Copyright

1 Year On Track Innovations Chart

1 Year On Track Innovations Chart

1 Month On Track Innovations Chart

1 Month On Track Innovations Chart

Your Recent History

Delayed Upgrade Clock