ADVFN Logo ADVFN

We could not find any results for:
Make sure your spelling is correct or try broadening your search.

Trending Now

Toplists

It looks like you aren't logged in.
Click the button below to log in and view your recent history.

Hot Features

Registration Strip Icon for discussion Register to chat with like-minded investors on our interactive forums.

NSEC National Security Group Inc

16.36
0.00 (0.00%)
Pre Market
Last Updated: 01:00:00
Delayed by 15 minutes
Share Name Share Symbol Market Type
National Security Group Inc NASDAQ:NSEC NASDAQ Common Stock
  Price Change % Change Share Price Bid Price Offer Price High Price Low Price Open Price Shares Traded Last Trade
  0.00 0.00% 16.36 16.32 16.40 0 01:00:00

The National Security Group, Inc. Releases Third Quarter Earnings

30/10/2008 9:00pm

Business Wire


National Security (NASDAQ:NSEC)
Historical Stock Chart


From Jul 2019 to Jul 2024
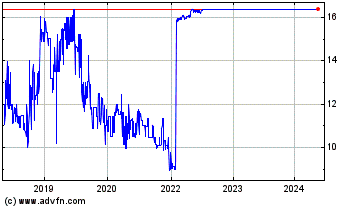
Click Here for more National Security Charts.
The National Security Group, Inc. (the Company) (Nasdaq: NSEC), today reported results for the quarter and nine months ended September 30, 2008 and 2007, based on accounting principles generally accepted in the United States of America, as follows:   Three Months Ended September 30   Nine Months Ended September 30     2008   2007   2008   2007   Premium Income $ 11,707,000 $ 15,913,000 $ 42,261,000 $ 46,362,000 Investment Income 1,332,000 1,216,000 3,894,000 3,629,000 Realized Investment (Losses) Gains (1,174,000 ) (4,000 ) (1,026,000 ) 529,000 Other Income 254,000   261,000   927,000   820,000 Total Revenues $ 12,119,000   $ 17,386,000   $ 46,056,000   $ 51,340,000   (Loss) Income from Continuing Operations $ (6,945,000 ) $ 1,505,000 $ (6,199,000 ) $ 3,169,000 Income (Loss) from Discontinued Operations -   -   -   1,319,000 Net (Loss) Income $ (6,945,000 ) $ 1,505,000   $ (6,199,000 ) $ 4,488,000   (Loss) Earnings Per Share from Continuing Operations $ (2.82 ) $ 0.61 $ (2.51 ) $ 1.28 Earnings Per Share from Discontinued Operations -   -   -   0.54 Net (Loss) Earnings Per Common Share $ (2.82 ) $ 0.61   $ (2.51 ) $ 1.82 For the three months ended September 30, 2008, the Company reported a net loss of $(6,945,000) or $(2.82) per share, as compared to net income of $1,505,000, or $0.61 per share in the same three month period last year. Primary factors contributing to the loss for the three months ended September 30, 2008 are investment write downs due to “Other Than Temporary Impairments” in the investment portfolio and catastrophe losses from Hurricane Gustav and Hurricane Ike. Investment write downs totaled $(1,277,000) net of tax, or $(0.52) per share. Hurricane losses from insurance claims incurred from Hurricane Gustav and Hurricane Ike totaled $(5,900,000) net of tax, or $(2.39) per share. Premium revenue for the three month period ended September 30, 2008 declined 26% compared to the same period last year. The most significant factor contributing to the decline in premium revenue for the quarter was an increase in ceded premium due to the payment of catastrophe reinstatement premium triggered by Hurricane Gustav. However, the Company has experienced a decline in core premium revenue of 7% during 2008. For the nine months ended September 30, 2008, the Company reported a net loss of $(6,199,000) or $(2.51) per share, as compared to net income of $4,488,000, or $1.82 per share in the same nine month period last year. Third quarter hurricane and investment losses were the primary factors contributing to the year to date loss in 2008. Shareholders’ equity as of September 30, 3008 totaled $35,106,000, a decline of 22% for the quarter. Hurricane losses and realized investment losses due to impairment write downs were the primary factors contributing to the decline in the Company’s capital position. However, a decline in market value of the Company’s investment portfolio of approximately 5% led to a decline in accumulated unrealized capital gains of $5,346,000 further reducing the capital position of the Company at September 30, 2008. While the decline in the Company’s capital position due to these unprecedented events of the last quarter have been significant, the Company remains well capitalized at levels that are sufficient to support current business plans. The National Security Group, Inc., through its property & casualty and life insurance subsidiaries, offers property, casualty, life, accident and health insurance in twelve states.

1 Year National Security Chart

1 Year National Security Chart

1 Month National Security Chart

1 Month National Security Chart

Your Recent History

Delayed Upgrade Clock