ADVFN Logo ADVFN

We could not find any results for:
Make sure your spelling is correct or try broadening your search.

Trending Now

Toplists

It looks like you aren't logged in.
Click the button below to log in and view your recent history.

Hot Features

Registration Strip Icon for default Register for Free to get streaming real-time quotes, interactive charts, live options flow, and more.

NSEC National Security Group Inc

16.36
0.00 (0.00%)
Pre Market
Last Updated: 01:00:00
Delayed by 15 minutes
Share Name Share Symbol Market Type
National Security Group Inc NASDAQ:NSEC NASDAQ Common Stock
  Price Change % Change Share Price Bid Price Offer Price High Price Low Price Open Price Shares Traded Last Trade
  0.00 0.00% 16.36 16.32 16.40 0 01:00:00

National Security Group, Inc. Releases Earnings

28/02/2008 7:30pm

Business Wire


National Security (NASDAQ:NSEC)
Historical Stock Chart


From Jul 2019 to Jul 2024
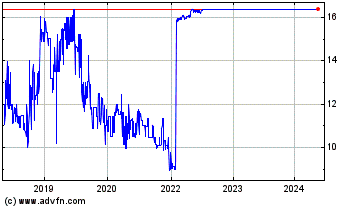
Click Here for more National Security Charts.
The National Security Group, Inc. (NASDAQ: NSEC) today announced its financial results for the year and three month periods ended December 31, 2007. Total revenues for the year increased 3.65% to $69,563,000 compared to $67,113,000 for 2006. Leading the increase in total revenue was a 5.73% increase in premium revenue to $62,250,000 in 2007 compared to 58,874,000 for the year 2006. Growth in the dwelling fire and homeowners lines of business in the property and casualty subsidiaries were the primary contributors to the growth in premium revenue. Net income for the year increased 42.12% to $6,040,000, or $2.45 per share, compared with net income of 4,250,000, or $1.72 per share for 2006. Net income from continuing operations of the insurance subsidiaries was $4,721,000 compared to $4,439,000 in 2006, an increase of 6.35%. Increased earnings in the property and casualty subsidiary were the primary contributor to the increase in earnings for the year. Net income from discontinued operations of $1,319,000 consisted of a gain on disposal of the majority of a 50% investment in Mobile Attic, Inc. in the second quarter of 2007. The Company maintains a 5% interest in Mobile Attic. Mobile Attic’s net loss from discontinued operations for 2006 was $189,000. Fourth quarter 2007 net income declined 2.08% to $1,552,000, or $0.63 per share, compared to $1,585,000, or $0.64 per share for the quarter ended December 31, 2006. Moderate adverse development on claims incurred in prior years was the primary contributor to the decrease in earnings during the fourth quarter. There was no material contribution to net income from discontinued operations in the fourth quarter of 2007. Stockholders equity for the year ended December 31, 2007 was $48,447,000 compared to $45,379,000 at December 31, 2006, an increase of $3,068,000 or 6.76%. The change in stockholders equity is composed of dividends paid to shareholders of $2,220,000; net income of $6,040,000 and a decline in accumulated other comprehensive income, consisting of accumulated unrealized capital losses, of $752,000. Year end book value per share, defined as stockholders equity divided by common shares outstanding of 2,466,600, was $19.64 at December 31, 2007 compared to $18.39 at December 31, 2006.       Three Months Year Ended December 31 Ended December 31 2007   2006 2007   2006 Premium Earned $ 15,888,000 $ 14,331,000 $ 62,250,000 $ 58,874,000 Investment Income 1,120,000 1,109,000 4,749,000 4,463,000 Realized Investment Gains 964,000 646,000 1,493,000 2,565,000 Other Income 251,000 274,000 1,071,000 1,211,000 Total Revenues   18,223,000 16,360,000 69,563,000 67,113,000 Net Income $ 1,552,000 $ 1,585,000 $ 6,040,000 $ 4,250,000 Net Income Per Share $ 0.63 $ 0.64 $ 2.45 $ 1.72   The National Security Group, Inc., through three wholly owned subsidiaries, offers a range of personal lines life, accident and health, property and liability insurance in twelve states. The Company is listed on the NASDAQ Global Market under the symbol: NSEC. For more financial information please visit the investor section our website www.nationalsecuritygroup.com.

1 Year National Security Chart

1 Year National Security Chart

1 Month National Security Chart

1 Month National Security Chart