ADVFN Logo ADVFN

We could not find any results for:
Make sure your spelling is correct or try broadening your search.

Trending Now

Toplists

It looks like you aren't logged in.
Click the button below to log in and view your recent history.

Hot Features

Registration Strip Icon for charts Register for streaming realtime charts, analysis tools, and prices.

CWST Casella Waste Systems Inc

106.23
0.97 (0.92%)
Last Updated: 20:26:29
Delayed by 15 minutes
Share Name Share Symbol Market Type
Casella Waste Systems Inc NASDAQ:CWST NASDAQ Common Stock
  Price Change % Change Share Price Bid Price Offer Price High Price Low Price Open Price Shares Traded Last Trade
  0.97 0.92% 106.23 106.18 106.27 107.19 105.35 105.98 387,415 20:26:29

Casella Waste Systems, Inc. Announces Third Quarter Fiscal Year 2007 Results

07/03/2007 11:26pm

PR Newswire (US)


Casella Waste Systems (NASDAQ:CWST)
Historical Stock Chart


From Jul 2019 to Jul 2024
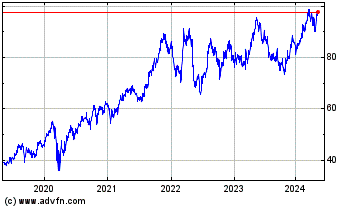
Click Here for more Casella Waste Systems Charts.
RUTLAND, Vt., March 7 /PRNewswire-FirstCall/ -- Casella Waste Systems, Inc. (NASDAQ:CWST), a regional, non-hazardous solid waste services company, today reported financial results for the third quarter and first nine months of its 2007 fiscal year. Third Quarter Results For the quarter ended January 31, 2007, the company reported revenues of $133.5 million, up $2.9 million, or 2.2 percent over the same quarter last year. The company's net loss per common share was $0.07, compared to net income of $0.02 per share in the same quarter last year. Operating income for the quarter was $8.8 million, up $1.7 million or 23.9 percent over the same quarter last year after deferred costs are excluded from fiscal year 2006 third quarter results. Cash provided by operating activities in the quarter was $16.4 million, down $9.4 million, or 36.4 percent compared to the same quarter last year. The company's earnings before interest, taxes, depreciation and amortization (EBITDA) were $26.0 million*, up $2.4 million, or 10.2 percent from the same quarter last year. A reduction of $2.0 million in equity income from the company's GreenFiber joint venture, and the expectation that this reduction will continue into the fourth quarter, increased the company's tax rate. These factors accounted for most of the $0.07 loss per common share. For the nine months ended January 31, 2007, the company reported revenues of $424.8 million. The company's net loss per common share was $0.05. Operating income for the nine month period was $32.1 million. Cash provided by operating activities for the nine month period was $55.8 million. The company's earnings before interest, taxes, depreciation and amortization (EBITDA) were $86.5 million*. Highlights of the Quarter "From an operating perspective, this was a solid quarter," John W. Casella, chairman and chief executive officer, said. "We continue to drive efficiencies into, and costs out of, the business, as well as driving pricing improvement across our solid waste business throughout the quarter. "Regional economic conditions had an impact on our overall results," Casella said. "While landfill pricing is up, volumes remain a challenge. Our GreenFiber unit was adversely impacted by the general slowdown in the housing market and unseasonably warm weather." The Company also said it believes its EBITDA* for fiscal year 2007 will be between $110.0 million and $113.0 million. *Non-GAAP Financial Measures In addition to disclosing financial results prepared in accordance with Generally Accepted Accounting Principles (GAAP), we also disclose free cash flow and earnings before interest, taxes, depreciation and amortization and deferred costs (EBITDA), which are non-GAAP measures. These measures are provided because we understand that certain investors use this information when analyzing the financial position of companies in the solid waste industry, including us. Historically, these measures have been key in comparing operating efficiency of publicly traded companies in the solid waste industry, and assist investors in measuring our ability to meet capital expenditure and working capital requirements. For these reasons we utilize these non- GAAP metrics to measure our performance at all levels. These measures do not represent, and should not be considered as alternatives to cash provided by operating activities as determined in accordance with GAAP. Moreover, these measures do not necessarily indicate whether cash flow will be sufficient for such items as working capital or capital expenditures, or to react to changes in our industry or to the economy generally. Because these measures are not calculated by all companies in the same fashion, they may not be comparable to similarly titled measures reported by other companies. Casella Waste Systems, headquartered in Rutland, Vermont, provides solid waste management services consisting of collection, transfer, disposal, and recycling services primarily in the eastern United States. For further information, contact Richard Norris, chief financial officer; Ned Coletta, director of investor relations; or Joseph Fusco, vice president; at (802) 775-0325, or visit the company's website at http://www.casella.com/. The company will host a conference call to discuss these results on Thursday, March 8, 2007 at 10:00 a.m. ET. Individuals interested in participating in the call should dial [(719) 457-2692] at least 10 minutes before start time. The call will also be webcast; to listen, participants should visit Casella Waste Systems' website at http://www.casella.com/ and follow the appropriate link to the webcast. A replay of the call will be available by calling (719) 457-0820 [(conference code #3642447)] before 11:59 p.m. ET, Thursday, March 15, 2007, or by visiting the company's website. Safe Harbor Statement Certain matters discussed in this press release are "forward-looking statements" intended to qualify for the safe harbors from liability established by the Private Securities Litigation Reform Act of 1995. These forward-looking statements can generally be identified as such by the context of the statements, including words such as the Company "believes," "expects," "anticipates," "plans," "may," "will," "would," "intends," "estimates" and other similar expressions, whether in the negative or affirmative. These forward-looking statements are based on current expectations, estimates, forecasts and projections about the industry and markets in which we operate and management's beliefs and assumptions. We cannot guarantee that we actually will achieve the plans, intentions or expectations disclosed in the forward- looking statements made. Such forward-looking statements, and all phases of our operations, involve a number of risks and uncertainties, any one or more of which could cause actual results to differ materially from those described in our forward-looking statements. Such risks and uncertainties include or relate to, among other things: prices for our services fluctuate due to reasons beyond our control; the development of landfills and other disposal facilities is inherently risky and is subject to political, regulatory, and other factors; we may be unable to make acquisitions; we may be unable to reduce costs sufficiently to achieve estimated EBITDA and other targets; anticipated revenue may not materialize; continuing weakness in general economic conditions and poor weather conditions may affect our revenues; we may be required to incur capital expenditures in excess of our estimates; and fluctuations in the commodity pricing of our recyclables may make it more difficult for us to predict our results of operations or meet our estimates. There are a number of other important risks and uncertainties that could cause our actual results to differ materially from those indicated by such forward- looking statements. These risks and uncertainties include, without limitation, those detailed in Item 1A, "Risk Factors" in our Form 10-K for the year ended April 30, 2006. We do not necessarily intend to update publicly any forward-looking statements whether as a result of new information, future events or otherwise. CASELLA WASTE SYSTEMS, INC. AND SUBSIDIARIES CONSOLIDATED STATEMENTS OF OPERATIONS Unaudited (In thousands, except amounts per share) Three Months Ended Nine Months Ended January January January January 31, 31, 31, 31, 2006 2007 2006 2007 Revenues $130,597 $133,492 $399,392 $424,828 Operating expenses: Cost of operations 89,034 89,800 262,704 279,717 General and administration 17,946 17,653 53,296 58,578 Depreciation and amortization 16,525 17,223 49,572 54,457 Deferred costs 1,329 - 1,329 - 124,834 124,676 366,901 392,752 Operating income 5,763 8,816 32,491 32,076 Other expense/(income), net: Interest expense, net 8,188 10,010 23,359 29,324 Income from equity method investments (3,319) (988) (4,762) (1,978) Other income (1,541) (50) (1,664) (351) 3,328 8,972 16,933 26,995 Income (loss) before income taxes 2,435 (156) 15,558 5,081 Provision for income taxes 1,148 689 7,005 3,590 Net income (loss) 1,287 (845) 8,553 1,491 Preferred stock dividend 859 902 2,563 2,674 Net (loss) income available to common stockholders $428 $(1,747) $5,990 $(1,183) Common stock and common stock equivalent shares outstanding, assuming full dilution 25,413 25,273 25,296 25,257 Net (loss) income per common share $0.02 $(0.07) $0.24 $(0.05) EBITDA (1) $23,617 $26,039 $83,392 $86,533 CASELLA WASTE SYSTEMS, INC. AND SUBSIDIARIES CONDENSED CONSOLIDATED BALANCE SHEETS Unaudited (In thousands) April 30 January 31, ASSETS 2006 2007 CURRENT ASSETS: Cash and cash equivalents $7,429 $11,929 Restricted cash 72 73 Accounts receivable - trade, net of allowance for doubtful accounts 56,269 57,839 Other current assets 15,204 23,395 Total current assets 78,974 93,236 Property, plant and equipment, net of accumulated depreciation 481,284 506,797 Goodwill 171,258 172,731 Intangible assets, net 2,762 2,276 Restricted cash 17,887 12,518 Investments in unconsolidated entities 44,491 48,811 Other non-current assets 14,455 13,242 $811,111 $849,611 LIABILITIES AND STOCKHOLDERS' EQUITY CURRENT LIABILITIES: Current maturities of long-term debt $527 $1,132 Current maturities of capital lease obligations 1,061 1,096 Accounts payable 46,364 41,316 Other accrued liabilities 46,813 51,834 Total current liabilities 94,765 95,378 Long-term debt, less current maturities 452,720 479,370 Capital lease obligations, less current maturities 1,747 925 Other long-term liabilities 41,959 50,468 Series A redeemable, convertible preferred stock 70,430 73,104 Stockholders' equity 149,490 150,366 $811,111 $849,611 CASELLA WASTE SYSTEMS, INC. AND SUBSIDIARIES CONDENSED CONSOLIDATED STATEMENTS OF CASH FLOWS Unaudited (In thousands) Nine Months Ended January 31, January 31, 2006 2007 Cash Flows from Operating Activities: Net income $8,553 $1,491 Adjustments to reconcile net income to net cash provided by operating activities - Depreciation and amortization 49,572 54,457 Depletion of landfill operating lease obligations 4,651 5,543 Income from equity method investments (4,762) (1,978) Deferred costs 1,329 - (Gain) loss on sale of equipment 233 (591) Stock-based compensation - 511 Excess tax benefit on the exercise of stock options - (145) Deferred income taxes 4,012 464 Changes in assets and liabilities, net of effects of acquisitions and divestitures (1,145) (3,949) 53,890 54,312 Net Cash Provided by Operating Activities 62,443 55,803 Cash Flows from Investing Activities: Acquisitions, net of cash acquired (19,226) (2,087) Additions to property, plant and equipment - growth (36,552) (25,757) - maintenance (51,608) (52,592) Payments on landfill operating lease contracts (8,450) (4,500) Restricted cash from revenue bond issuance - 5,535 Other (1,463) (110) Net Cash Used In Investing Activities (117,299) (79,511) Cash Flows from Financing Activities: Proceeds from long-term borrowings 159,733 239,950 Principal payments on long-term debt (104,581) (213,459) Proceeds from exercise of stock options 1,151 1,572 Excess tax benefit on the exercise of stock options - 145 Net Cash Provided by Financing Activities 56,303 28,208 Net increase in cash and cash equivalents 1,447 4,500 Cash and cash equivalents, beginning of period 8,578 7,429 Cash and cash equivalents, end of period $10,025 $11,929 CASELLA WASTE SYSTEMS, INC. AND SUBSIDIARIES Unaudited (In thousands) Note 1: Non - GAAP Financial Measures In addition to disclosing financial results prepared in accordance with Generally Accepted Accounting Principles (GAAP), we also disclose EBITDA (earnings before interest, taxes, depreciation and amortization and deferred costs) and Free Cash Flow, which are non-GAAP measures. These measures are provided because we understand that certain investors use this information when analyzing the financial position of the solid waste industry, including us. Historically, these measures have been key in comparing operating efficiency of publicly traded companies within the industry, and assist investors in measuring our ability to meet capital expenditure and working capital requirements. For these reasons, we utilize these non-GAAP metrics to measure our performance at all levels. These measures do not represent, and should not be considered as alternatives to net cash provided by operating activities as determined in accordance with GAAP. Moreover, these measures do not necessarily indicate whether cash flow will be sufficient for such items as working capital or capital expenditures, or to react to changes in our industry or to the economy generally. Because these measures are not calculated by all companies in the same fashion, they may not be comparable to similarly titled measures reported by other companies. Following is a reconciliation of EBITDA to Net Cash Provided by Operating Activities: Three Months Ended Nine Months Ended January January January January 31, 31, 31, 31, 2006 2007 2006 2007 Net Cash Provided by Operating Activities $25,839 $16,403 $62,443 $55,803 Changes in assets and liabilities, net of effects of acquisitions and divestitures (8,128) 89 1,145 3,949 Deferred income taxes (19) 613 (4,012) (464) Stock-based compensation - (190) - (511) Excess tax benefit on the exercise of stock options - 4 - 145 Provision for income taxes 1,148 689 7,005 3,590 Interest expense, net 8,188 10,010 23,359 29,324 Depletion of landfill operating lease obligations (1,678) (1,681) (4,651) (5,543) Gain (loss) on sale of equipment (192) 152 (233) 591 Other income (1,541) (50) (1,664) (351) EBITDA $23,617 $26,039 $83,392 $86,533 Following is a reconciliation of Free Cash Flow to Net Cash Provided by Operating Activities: Three Months Ended Nine Months Ended January January January January 31, 31, 31, 31, 2006 2007 2006 2007 EBITDA $23,617 $26,039 $83,392 $86,533 Add (deduct): Cash interest (3,557) (5,069) (16,379) (21,696) Capital expenditures (23,261) (18,094) (88,160) (78,349) Cash taxes (240) (648) (1,299) (2,241) Depletion of landfill operating lease obligations 1,677 1,682 4,651 5,543 Change in working capital, adjusted for non-cash items 2,934 (5,879) (7,969) (11,513) FREE CASH FLOW 1,170 (1,969) (25,764) (21,723) Add (deduct): Capital expenditures 23,261 18,094 88,160 78,349 Other 1,408 278 47 (823) Net Cash Provided by Operating Activities $25,839 $16,403 $62,443 $55,803 CASELLA WASTE SYSTEMS, INC. AND SUBSIDIARIES SUPPLEMENTAL DATA TABLES (Unaudited) (In thousands) Amounts of the Company's total revenues attributable to services provided are as follows: Three Months Ended Nine Months Ended January 31, January 31, 2006 2007 2006 2007 Collection $61,310 $62,478 $192,729 $199,748 Landfill / disposal facilities 24,167 24,183 73,928 82,590 Transfer 10,713 9,255 34,275 33,200 Recycling 34,407 37,576 98,460 109,290 Total revenues $130,597 $133,492 $399,392 $424,828 Components of revenue growth for the three months ended January 31, 2007 compared to the three months ended January 31, 2006: Percentage Solid Waste Operations (1) Price 3.3% Volume -4.8% Solid waste commodity price and volume 0.3% Total growth - Solid Waste Operations -1.2% FCR Operations (1) Price 0.1% Volume 5.2% Total growth - FCR Operations 5.3% Rollover effect of acquisitions (as a percentage of total revenues) 1.2% Divestitures (as a percentage of total revenues) 0.0% Total revenue growth 2.2% (1) -- Calculated as a percentage of segment revenues. Solid Waste Internalization Rates by Region: Three Months Ended Nine Months Ended January 31, January 31, 2006 2007 2006 2007 North Eastern region 56.8% 52.8% 57.5% 56.1% South Eastern region 39.6% 45.3% 40.9% 42.2% Central region 79.7% 77.1% 79.0% 77.4% Western region 44.1% 46.8% 42.4% 48.8% Solid Waste Operations 57.0% 57.1% 56.0% 57.8% US GreenFiber (50% owned) Financial Statistics: Three Months Ended Nine Months Ended January 31, January 31, 2006 2007 2006 2007 Revenues $57,484 $48,999 $132,022 $145,525 Net income 6,632 2,634 9,524 5,418 Cash flow from operations 1,980 3,833 11,945 13,076 Net working capital changes (6,544) (1,439) (2,948) (58) EBITDA $8,524 $5,272 $14,893 $13,134 As a percentage of revenue: Net income 11.5% 5.4% 7.2% 3.7% EBITDA 14.8% 10.8% 11.3% 9.0% Components of Growth versus Maintenance Capital Expenditures (1): Three Months Ended Nine Months Ended January 31, January 31, 2006 2007 2006 2007 Growth Capital Expenditures: Landfill Development $8,733 $3,282 $27,334 $14,765 Boston MRF Building - - 5,998 - MRF Equipment Upgrades - 2,982 - 6,239 Other 1,940 1,273 3,220 4,753 Total Growth Capital Expenditures 10,673 7,537 36,552 25,757 Maintenance Capital Expenditures: Vehicles, Machinery / Equipment and Containers 2,119 2,266 23,620 21,632 Landfill Construction & Equipment 8,728 7,300 22,769 26,851 Facilities 1,209 900 4,260 2,921 Other 532 91 959 1,188 Total Maintenance Capital Expenditures 12,588 10,557 51,608 52,592 Total Capital Expenditures $23,261 $18,094 $88,160 $78,349 (1) The Company's capital expenditures are broadly defined as pertaining to either growth or maintenance activities. Growth capital expenditures are defined as costs related to development of new airspace, permit expansions, new recycling contracts along with incremental costs of equipment and infrastructure added to further such activities. Growth capital expenditures include the cost of equipment added directly as a result of new business as well as expenditures associated with increasing infrastructure to increase throughput at transfer stations and recycling facilities. Growth capital expenditures also include those outlays associated with acquiring landfill operating leases, which do not meet the operating lease payment definition, but which were included as a commitment in the successful bid. Maintenance capital expenditures are defined as landfill cell construction costs not related to expansion airspace, costs for normal permit renewals and replacement costs for equipment due to age or obsolescence. DATASOURCE: Casella Waste Systems, Inc. CONTACT: Richard Norris, chief financial officer, or Ned Coletta, director of investor relations, or Joseph Fusco, vice president, all of Casella Waste Systems, Inc., +1-802-775-0325 Web site: http://www.casella.com/

Copyright

1 Year Casella Waste Systems Chart

1 Year Casella Waste Systems Chart

1 Month Casella Waste Systems Chart

1 Month Casella Waste Systems Chart

Your Recent History

Delayed Upgrade Clock