ADVFN Logo ADVFN

We could not find any results for:
Make sure your spelling is correct or try broadening your search.

Trending Now

Toplists

It looks like you aren't logged in.
Click the button below to log in and view your recent history.

Hot Features

Registration Strip Icon for monitor Customisable watchlists with full streaming quotes from leading exchanges, such as LSE, NASDAQ, NYSE, AMEX, Bovespa, BIT and more.

ANEN Anaren, Inc. (MM)

27.98
0.00 (0.00%)
Pre Market
Last Updated: 01:00:00
Delayed by 15 minutes
Share Name Share Symbol Market Type
Anaren, Inc. (MM) NASDAQ:ANEN NASDAQ Common Stock
  Price Change % Change Share Price Bid Price Offer Price High Price Low Price Open Price Shares Traded Last Trade
  0.00 0.00% 27.98 0 01:00:00

Anaren Reports 2nd Quarter Results

01/02/2007 9:15pm

PR Newswire (US)


Anaren, Inc. (MM) (NASDAQ:ANEN)
Historical Stock Chart


From Jul 2019 to Jul 2024
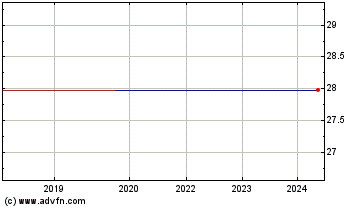
Click Here for more Anaren, Inc. (MM) Charts.
SYRACUSE, N.Y., Feb. 1 /PRNewswire-FirstCall/ -- Anaren, Inc. (NASDAQ:ANEN) today reported record net sales for the second quarter ended December 31, 2006 of $30.3 million, up 21% from the second quarter of fiscal year 2006. (Logo: http://www.newscom.com/cgi-bin/prnh/20021022/NYTU197LOGO ) Net income for the second quarter of fiscal 2007 was $4.0 million, or $0.22 per diluted share, up 101% from the second quarter of last year. Net income for the quarter included $0.04 per diluted share in stock based compensation expense. Excluding stock based compensation expense, net income for the second quarter was $4.7 million, or $0.26 per diluted share. The effective tax rate for the second quarter of fiscal 2007 was 21.6%, compared to 27.4% for the second quarter of fiscal 2006. Operating income for the second quarter of fiscal 2007 was $4.3 million, or 14.0% of net sales, up 90% from the second quarter of last year. Operating income for the quarter included $820,000 in stock based compensation expense. Excluding stock based compensation expense, operating income for the second quarter of fiscal 2007 was $5.1 million, or 16.7% of net sales. Lawrence A. Sala, Anaren's President and CEO said, "The overall growth in net sales for the quarter was driven by strong growth in Space & Defense Group net sales which offset reduced demand for wireless infrastructure products. The continued growth in net sales and a favorable product mix positively impacted our profitability for the quarter." Mr. Sala added, "Though the general decline in wireless infrastructure demand continued throughout the quarter, we continue to see numerous new wireless consumer and infrastructure product opportunities." For the six months ended December 31, 2006, net sales were $60.5 million, up 22% from the first six months of fiscal 2006. Operating income for the first six months of fiscal 2007 was $8.4 million, or 13.8% of net sales, including $1.6 million, or 2.7% of net sales, in stock based compensation expense. Operating income before stock based compensation expense for the first six months of fiscal 2007 was 16.6% of net sales. Net income for the first six months of fiscal 2007 was $7.8 million, or $0.43 per diluted share, including $0.08 per diluted share in stock based compensation expense. This compares to net income for the first six months of fiscal 2006 of $4.2 million, or $0.24 per diluted share, which included $1.7 million in stock based compensation expense. Balance Sheet Cash, cash equivalents and marketable debt securities at December 31, 2006 were $91.5 million. During the quarter, the Company generated $7.2 million in cash from operations which consisted of the $4.0 million in net income and a $3.6 million decrease in accounts receivable which was partially offset by a $2.1 million increase in inventory. Expenditures for capital additions in the second quarter were $3.9 million driven primarily by the building expansion at the Company's East Syracuse, New York manufacturing facility and capital equipment purchases for the Company's newly acquired Suzhou, China facility. Wireless Group Wireless Group net sales for the quarter were $17.0 million, up 9.7% from the second quarter of fiscal 2006 but down 14% from the first quarter of fiscal year 2007. Reduced demand across all wireless infrastructure product lines from first quarter levels continued throughout the quarter. Sales of consumer component products were $1.8 million for the quarter, up 68% from the second quarter of last year. Product development activity remains focused on expanding the ferrite and consumer component product lines. During the quarter, the Company introduced several new filter products for satellite television applications. "We are pleased with the progress of our new product development efforts as well as the number and quality of new business opportunities for both infrastructure and consumer applications," said Mr. Sala. Customers that generated 10% of Wireless Group net sales or greater for the quarter were Motorola, Inc. and Nokia Corp. Space & Defense Group Space & Defense Group net sales for the quarter were $13.3 million, up 40% from the second quarter of fiscal 2006 due largely to production relating to the recently announced contracts with SRCTec, Inc. New orders for the quarter totaled $12.7 million and included contracts for airborne and ground based radar receiver and jammer components and subsystems. Research and development investment is focused on increasing the integration, functionality and frequency range of radar and receiver related products. Space & Defense backlog at December 31, 2006 was $50.7 million. Outlook For the third quarter, we expect moderate demand for wireless infrastructure products, a seasonally driven decrease in demand for the consumer component product line and continued strong sales for the Space & Defense segment as a result of recent new contract wins. As a result, we expect net sales to be in the range of $27.0 - $30.0 million for the third quarter of fiscal 2007. With an anticipated tax rate of approximately 25% and an expected stock based compensation expense of approximately $0.04 per diluted share, we expect net earnings per diluted share to be in the range of $0.16 - $0.21 for the third quarter. Forward-Looking Statements The statements contained in this news release which are not historical information are "forward-looking statements". These, and other forward- looking statements, are subject to business and economic risks and uncertainties that could cause actual results to differ materially from those discussed. The risks and uncertainties described below are not the only risks and uncertainties facing our Company. Additional risks and uncertainties not presently known to us or that are currently deemed immaterial may also impair our business operations. If any of the following risks actually occur, our business could be adversely affected, and the trading price of our common stock could decline, and you may lose all or part of your investment. On January 31, the Company filed an amended Annual Report on Form 10-k/A for the fiscal year 2006 restating the Company's consolidated financial statements for the fiscal year 2006 and the fiscal year 2004, modified related disclosures, and disclosed material weaknesses in the Company's disclosure controls and procedures. The Company additionally filed on January 31, 2007 amended Quarterly Reports on Form 10-Q/A for the periods ending December 31, 2005, March 31, 2006 and September 30, 2006. The Company cannot predict the reaction to the filing of these Amended Reports and if adverse, the market price of the Company's stock could decline. Other known factors include, but are not limited to: the Company's ability to timely ramp up to meet some of our customers' increased demands; unanticipated delays and/or difficulties associated with relocating the Company's Suzhou China facility and successfully completing all requalification procedures; potential unanticipated liabilities and delays associated with the physical expansion of the Company's Syracuse, New York facility; unanticipated delays in successfully completing customer orders within contractually required timeframes; increased pricing pressure from our customers; decreased capital expenditures by wireless service providers; the possibility that the Company may be unable to successfully execute its business strategies or achieve its operating objectives, generate revenue growth or achieve profitability expectations; successfully securing new design wins from our OEM customers, reliance on a limited number of key component suppliers, unpredictable difficulties or delays in the development of new products; order cancellations or extended postponements; the risks associated with any technological shifts away from the Company's technologies and core competencies; unanticipated impairments of assets including investment values and goodwill; diversion of defense spending away from the Company's products and or technologies due to on-going military operations; and litigation involving antitrust, intellectual property, environmental, product warranty, product liability, and other issues. You are encouraged to review Anaren's 2006 Annual Report, Anaren's Form 10-K/A for the fiscal year ended June 30, 2006, Anaren's Form 10-Q for the three months ended September 30, 2006, Anaren's Form 10-Q/A for the three months ended December 31, 2006 and exhibits to those Reports filed with the Securities and Exchange Commission to learn more about the various risks and uncertainties facing Anaren's business and their potential impact on Anaren's revenue, earnings and stock price. Unless required by law, Anaren disclaims any obligation to update or revise any forward-looking statement. Conference Call Anaren will host a live teleconference, open to the public, on the Anaren Investor Info, Live Webcast Web Site (http://www.anaren.com/) and ccbn.com at http://www.streetevents.com/ on Thursday, February 1 at 5:00 p.m. EDT. A replay of the conference call will be available at 8:00 p.m. (EDT) beginning February 1, 2007 through midnight February 5, 2007. To listen to the replay, interested parties may dial in the U.S. at 1-888-203-1112 and international at 1-719-457-0820. The access code is 5964893. If you are unable to access the Live Webcast, the dial in number for the U.S. is 1-800-474-8920 and International is 1-719-457-2727. Company Background Anaren designs, manufactures and sells complex microwave signal distribution networks and components for the wireless communications, satellite communications and defense electronics markets. For more information on Anaren's products, visit our Web site at http://www.anaren.com/. Anaren, Inc. and Subsidiaries Consolidated Condensed Statements of Income (Unaudited) Three Months Ended Six Months Ended Dec. 31, Dec. 31, Dec. 31, Dec. 31, 2006 2005 2006 2005 Sales $30,325,785 $25,019,013 $60,528,895 $49,633,371 Cost of sales 19,224,005 16,273,387 38,587,783 32,233,299 Gross profit 11,101,780 8,745,626 21,941,112 17,400,072 36.6% 35.0% 36.2% 35.1% Operating expenses: Marketing 1,928,858 1,715,660 3,741,564 3,483,739 Research and development 2,192,823 2,268,438 4,331,008 4,303,079 General and administrative 2,726,742 2,523,124 5,494,968 5,015,434 Total operating expenses 6,848,423 6,507,222 13,567,540 12,802,252 Operating income 4,253,357 2,238,404 8,373,572 4,597,820 14.0% 8.9% 13.8% 9.3% Other income (expense): Other income, primarily interest 917,080 536,821 1,813,686 1,124,565 Interest expense (6,143) (6,143) (12,286) (12,286) Total other income (expense) 910,937 530,678 1,801,400 1,112,279 Income before income taxes 5,164,294 2,769,082 10,174,972 5,710,099 Income taxes 1,116,000 759,000 2,366,000 1,474,000 Net income $4,048,294 $2,010,082 $7,808,972 $4,236,099 13.3% 8.0% 12.9% 8.5% Basic earnings per share $0.23 $0.12 $0.44 $0.25 Diluted earnings per share $0.22 $0.11 $0.43 $0.24 Shares used in computing net income Per share: Basic 17,622,700 17,020,360 17,557,429 17,211,315 Diluted 18,088,109 17,595,314 18,032,032 17,765,683 Anaren, Inc. and Subsidiaries Consolidated Condensed Statements of Income (Unaudited) Three Months Ended Stock Based W/O Stock Based Compensation Compensation GAAP Results Expense Expense Dec. 31, 2006 Dec. 31, 2006 Dec. 31, 2006 Net sales $30,325,785 $ - $30,325,785 Cost of sales 19,224,005 242,647 18,981,358 Gross profit 11,101,780 242,647 11,344,427 36.6% 37.4% Costs and expenses: Marketing 1,928,858 59,262 1,869,596 Research and development 2,192,823 103,965 2,088,858 General and administrative 2,726,742 414,007 2,312,735 Total operating expenses 6,848,423 577,234 6,271,189 Operating income 4,253,357 819,881 5,073,238 14.0% 2.8% 16.7% Other income (expense): Other, primarily interest income 917,080 - 917,080 Interest expense (6,143) - (6,143) Total other income, net 910,937 - 910,937 Income from continuing operations before income tax 5,164,294 819,881 5,984,175 Income taxes 1,116,000 (173,000) 1,289,000 Net Income $ 4,048,294 $ 646,881 $ 4,695,175 13.3% 15.5% Basic earnings per share $0.23 $0.04 $0.27 Diluted earnings per share $0.22 $0.04 $0.26 Shares used in computing net income per share Basic 17,622,700 17,622,700 17,622,700 Diluted 18,088,109 18,088,109 18,088,109 Anaren, Inc. and Subsidiaries Consolidated Condensed Statements of Income (Unaudited) Six Months Ended Stock Based W/O Stock Based Compensation Compensation GAAP Results Expense Expense Dec. 31, 2006 Dec. 31, 2006 Dec. 31, 2006 Net sales $60,528,895 $ - $60,528,895 Cost of sales 38,587,783 519,690 38,068,093 Gross profit 21,941,112 519,690 22,460,802 36.2% 37.1% Costs and expenses: Marketing 3,741,564 115,168 3,626,396 Research and development 4,331,008 172,636 4,158,372 General and administrative 5,494,968 842,053 4,652,915 Total operating expenses 13,567,540 1,129,857 12,437,683 Operating income 8,373,572 1,649,547 10,023,119 13.8% 2.7% 16.6% Other income (expense): Other, primarily interest income 1,813,686 - 1,813,686 Interest expense (12,286) - (12,286) Total other income, net 1,801,400 - 1,801,400 Income from continuing operations before income tax 10,174,972 1,649,547 11,824,519 Income taxes 2,366,000 (322,000) 2,688,000 Net Income $ 7,808,972 $ 1,327,547 $ 9,136,519 12.9% 15.1% Basic earnings per share $0.44 $0.08 $0.52 Diluted earnings per share $0.43 $0.08 $0.51 Shares used in computing net income per share Basic 17,557,429 17,557,429 17,557,429 Diluted 18,032,032 18,032,032 18,032,032 Anaren, Inc. and Subsidiaries Consolidated Condensed Balance Sheets Dec. 31, 2006 June 30, 2006 (Unaudited) Assets: Cash, cash equivalents and short-term investments $71,681,774 $82,492,947 Accounts receivable, net 16,451,375 16,362,011 Other receivables 1,763,909 1,336,009 Inventories 26,819,270 21,827,271 Other current assets 2,934,089 2,152,471 Total current assets 119,650,417 124,170,709 Net property, plant and equipment 31,226,848 27,635,161 Securities available for sale - - Securities held to maturity 19,865,894 6,131,425 Goodwill 30,715,861 30,715,861 Other intangibles 185,935 340,371 Other assets 32,902 32,902 Total assets $201,677,857 $189,026,429 Liabilities and stockholders' equity Liabilities: Accounts payable $7,769,666 $6,798,793 Accrued expenses 2,575,912 3,254,816 Customer advance payments 483,722 483,722 Other liabilities 963,172 1,473,011 Total current liabilities 11,792,472 12,010,342 Other non-current liabilities 5,535,266 4,897,687 Total liabilities 17,327,738 16,908,029 Stockholders' equity: Retained earnings 78,302,825 70,493,853 Common stock and additional paid-in capital 186,417,499 182,049,235 Accumulated comprehensive loss (386,914) (441,397) Less cost of treasury stock (79,983,291) (79,983,291) Total stockholders' equity 184,350,119 172,118,400 Total liabilities and stockholders' equity $201,677,857 $189,026,429 Anaren, Inc. and Subsidiaries Consolidated Condensed Statements of Cash Flows (Unaudited) Six Months Three Months Three Months Ended Ended Ended Dec. 31, 2006 Dec. 31, 2006 Sept. 30, 2006 Cash flows from operating activities: Net income $7,808,972 $4,048,294 $3,760,678 Adjustments to reconcile net income to net cash provided by operating activities: Depreciation and amortization of plant and equipment 2,524,216 1,120,904 1,403,312 Amortization of intangibles 154,436 74,218 80,218 Gain on sale of land (77,508) - (77,508) Stock based compensation 1,628,320 800,512 827,808 Provision for doubtful accounts (21,726) (23,005) 1,279 Deferred income taxes 248,000 103,000 145,000 Receivables (67,638) 3,602,359 (3,669,997) Inventories (4,991,999) (2,143,644) (2,848,355) Accounts payable 970,873 292,701 678,172 Other assets and liabilities (2,008,682) (710,936) (1,297,746) Net cash provided by (used in) operating activities 6,167,264 7,164,403 (997,139) Cash flows from investing activities: Capital expenditures (6,172,903) (3,902,635) (2,270,268) Increase in other assets - 341,448 (341,448) Proceeds from sale of land 134,508 - 134,508 Net maturities (purchases) of marketable debt and equity securities (647,869) 213,475 (861,344) Net cash used in investing activities (6,686,264) (3,347,712) (3,338,552) Cash flows from financing activities: Stock options exercised 2,111,188 885,391 1,225,797 Tax benefit from exercise of stock options 628,756 206,676 422,080 Net cash provided by financing activities 2,739,944 1,092,067 1,647,877 Effect of exchange rates 54,483 66,634 (12,151) Net increase (decrease) in cash and cash equivalents 2,275,427 4,975,392 (2,699,965) Cash and cash equivalents at beginning of period 15,733,214 13,033,249 15,733,214 Cash and cash equivalents at end of period $18,008,641 $18,008,641 $13,033,249 DATASOURCE: Anaren, Inc. CONTACT: Joseph E. Porcello, VP of Finance, +1-315-432-8909 Web site: http://www.newscom.com/cgi-bin/prnh/20021022/NYTU197LOGO Web site: http://www.anaren.com/

Copyright

1 Year Anaren, Inc. (MM) Chart

1 Year Anaren, Inc. (MM) Chart

1 Month Anaren, Inc. (MM) Chart

1 Month Anaren, Inc. (MM) Chart

Your Recent History

Delayed Upgrade Clock