ADVFN Logo ADVFN

We could not find any results for:
Make sure your spelling is correct or try broadening your search.

Trending Now

Toplists

It looks like you aren't logged in.
Click the button below to log in and view your recent history.

Hot Features

Registration Strip Icon for discussion Register to chat with like-minded investors on our interactive forums.

ACXM Acxiom Holdngs (delisted)

48.48
0.00 (0.00%)
After Hours
Last Updated: 01:00:00
Delayed by 15 minutes
Share Name Share Symbol Market Type
Acxiom Holdngs (delisted) NASDAQ:ACXM NASDAQ Common Stock
  Price Change % Change Share Price Bid Price Offer Price High Price Low Price Open Price Shares Traded Last Trade
  0.00 0.00% 48.48 48.34 51.50 0 01:00:00

Acxiom Announces Third-Quarter ResultsFinancials Q3 FY07Financial Road Map

24/01/2007 9:05pm

Business Wire


Acxiom (NASDAQ:ACXM)
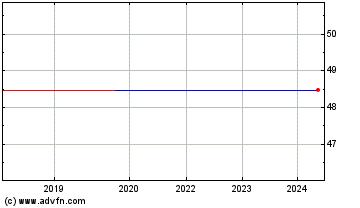
Historical Stock Chart


From Oct 2019 to Oct 2024
Click Here for more Acxiom Charts.
Acxiom® Corporation (Nasdaq: ACXM) today announced financial results for the third quarter of fiscal 2007 ended December 31, 2006. Acxiom will hold a conference call at 4:30 p.m. CST today to discuss this information further. Interested parties are invited to listen to the call, which will be broadcast via the Internet at www.acxiom.com. Third-quarter earnings per diluted share of $.31 included a $.02 benefit related to a lower-than-expected income tax rate and a $.01 expense related to organizational changes in Europe. Third-quarter earnings were equal to the $.31 per diluted share reported in the same quarter a year ago. Operating income for the quarter decreased 3 percent to $51.3 million. Third-quarter revenue totaled $352.8 million, an increase of 2 percent over the same quarter last year. “Our earnings continue to improve on a sequential basis but are not in line with our expectations due to slower than expected revenue growth,” Company Leader Charles D. Morgan said. “We continue to execute our company-wide initiatives to create more value for our clients and drive more rapid revenue growth. We expect to see more from those efforts over the next several quarters.” Details of Acxiom’s third-quarter performance include: Revenue of $352.8 million, up 2 percent from $347.4 million in the third quarter a year ago. Declines in revenue in the traditional IT outsourcing business and from one large client undergoing a merger negatively impacted the growth rate by 4 percentage points for the quarter and 5 percentage points year-to-date. Income from operations of $51.3 million, a 3 percent decrease compared to $52.7 million in the third quarter last year. Diluted earnings per share of $.31, equal to the third quarter of fiscal 2006. Operating cash flow of $62.7 million and free cash flow available to equity of $12.6 million. Free cash flow available to equity is a non-GAAP financial measure, and a reconciliation to the comparable GAAP measure, operating cash flow, is attached to this press release. Gross margin of 28.4 percent compared to 31.4 percent in the same quarter last year. Computer, communications and other equipment expense equaling 20.2 percent of revenue compared to 21.2 percent of revenue in the third quarter of fiscal 2006. Interest expense in the quarter was $14.9 million compared with $8.6 million in the same quarter a year ago. The increase reflects the $600 million term loan completed in September 2006. Proceeds from the term loan were used to retire debt and buy back approximately 11 million shares of Acxiom stock. “While our overall revenue growth number for the quarter was disappointing, there are several areas of our business that turned in encouraging performances – including our digital and risk businesses and our direct-to-market U.S. data business,” Morgan said. “We also showed strong growth in several key industries – including auto and insurance, which were both up 10 percent, year over year. We have continued to make investments to support future revenue growth, as evidenced by our recent acquisition of Equitec, which brings us strong marketing and merchandizing optimization expertise in the retail industry.” Morgan noted that General Motors awarded significant new business to Acxiom in the quarter and that the company has also recently completed new contracts with JPMorgan Chase & Co.; The Container Store; Colonial Penn® Life Insurance Company; and Sears Holdings. He also reported that Acxiom has been awarded significant business from a large European corporation in a deal pursued in partnership with EMC and Accenture. Outlook The Company’s expectations are communicated in the Financial Road Map, which includes a chart summarizing the one-year and long-term goals as well as an explanation of the assumptions and definitions that accompany these goals. Acxiom’s current Financial Road Map reflects the Company’s revised expectations for fiscal year 2007, and the long-term goals reflect expected performance in fiscal 2010. Acxiom anticipates fiscal 2007 earnings per diluted share between $0.92 and $0.97. This range is based on revising the income tax rate from 39 percent to 37 percent as a result of Congress’ extension of the Research and Experimentation tax credit and doesn’t reflect any European restructuring charges that may be incurred during the fourth quarter. These financial projections are based on the assumptions and limitations set forth in the Financial Road Map. These projections are forward looking, and actual results may differ materially. These projections may be impacted by mergers, acquisitions, divestitures or other business combinations that may be completed in the future as well as the other factors set forth below. About Acxiom Acxiom Corporation (Nasdaq: ACXM) integrates data, services and technology to create and deliver customer and information management solutions for many of the largest, most respected companies in the world. The core components of Acxiom’s innovative solutions are Customer Data Integration (CDI) technology, data, database services, IT outsourcing, consulting and analytics, and privacy leadership. Founded in 1969, Acxiom is headquartered in Little Rock, Arkansas, with locations throughout the United States and Europe, and in Australia, China and Canada. For more information, visit www.acxiom.com. This release and today’s conference call contain forward-looking statements that are subject to certain risks and uncertainties that could cause actual results to differ materially. Such statements may include but are not necessarily limited to the following: that we expect that our emphasis on revenue growth will lead to increased rates of revenue growth, that we expect that continued focus on expense controls will lead to continued improvement in operating margins, that the projected revenue, operating margin, return on assets and return on invested capital, operating cash flow and free cash flow, borrowings, dividends and other metrics referred to in the Financial Road Map attached to this release will be within the estimated ranges; that the Company has identified categories of opportunity that provide upside to the ranges of the Financial Road Map, that the estimations of revenue, earnings, cash flow, growth rates, restructuring charges and expense reductions will be within the estimated ranges; and that the business pipeline and our anticipated cost structure will allow us to continue to meet or exceed revenue, cash flow and other projections. The following are important factors, among others, that could cause actual results to differ materially from these forward-looking statements: The possibility that certain contracts may not be closed, or may not be closed within the anticipated time frames; the possibility that clients may attempt to reduce the amount of business they do with the Company; the possibility that in the event that a change of control of the Company was sought that certain of the clients of the Company would invoke certain provisions in their contracts resulting in a decline in the revenue and profit of the Company; the possibility that certain contracts may not generate the anticipated revenue or profitability; the possibility that negative changes in economic or other conditions might lead to a reduction in demand for our products and services; the possibility of an economic slowdown or that economic conditions in general will not be as expected; the possibility that the historical seasonality of our business may change; the possibility that significant customers may experience extreme, severe economic difficulty; the possibility that the integration of acquired businesses may not be as successful as planned; the possibility that the fair value of certain of our assets may not be equal to the carrying value of those assets now or in future time periods; the possibility that sales cycles may lengthen; the possibility that we may not be able to attract and retain qualified technical and leadership associates, or that we may lose key associates to other organizations; the possibility that we won’t be able to properly motivate our sales force or other associates; the possibility that we won’t be able to achieve cost reductions and avoid unanticipated costs; the possibility that we won’t be able to continue to receive credit upon satisfactory terms and conditions; the possibility that competent, competitive products, technologies or services will be introduced into the marketplace by other companies; the possibility that we may be subjected to pricing pressure due to market conditions and/or competitive products and services; the possibility that there will be changes in consumer or business information industries and markets that negatively impact the Company; the possibility that changes in accounting pronouncements may occur and may impact these projections; the possibility that we won’t be able to protect proprietary information and technology or to obtain necessary licenses on commercially reasonable terms; the possibility that we may encounter difficulties when entering new markets or industries; the possibility that there will be changes in the legislative, accounting, regulatory and consumer environments affecting our business, including but not limited to litigation, legislation, regulations and customs relating to our ability to collect, manage, aggregate and use data; the possibility that data suppliers might withdraw data from us, leading to our inability to provide certain products and services; the possibility that we may enter into short-term contracts which would affect the predictability of our revenues; the possibility that the amount of ad hoc, volume-based and project work will not be as expected; the possibility that we may experience a loss of data center capacity or interruption of telecommunication links or power sources; the possibility that we may experience failures or breaches of our network and data security systems, leading to potential adverse publicity, negative customer reaction, or liability to third parties; the possibility that postal rates may increase, thereby leading to reduced volumes of business; the possibility that our clients may cancel or modify their agreements with us; the possibility that we will not successfully complete customer contract requirements on time or meet the service levels specified in the contracts, which may result in contract penalties or lost revenue; the possibility that we experience processing errors which result in credits to customers, re-performance of services or payment of damages to customers; the possibility that the services of the United States Postal Service, their global counterparts and other delivery systems may be disrupted; and the possibility that we may be affected by other competitive factors. With respect to the Financial Road Map, all of the above factors apply, along with the following which were assumptions made in creating the Financial Road Map: that the U.S. and global economies will continue to improve at a moderate pace; that global growth will continue to be strong and that globalization trends will continue to grow at an increasing pace; that Acxiom’s computer, communications and other equipment expenses will continue to fall as a percentage of revenue; that the Customer Information Infrastructure (CII) grid-based environment will continue to be implemented successfully over the next 3-4 years and that the new CII infrastructure will continue to provide increasing operational efficiencies; that the acquisitions of companies operating primarily outside of the United States will be successfully integrated and that significant efficiencies will be realized from this integration; relating to operating cash flow and free cash flow, that sufficient operating and capital lease arrangements will continue to be available to the Company to provide for the financing of most of its computer equipment and that software suppliers will continue to provide financing arrangements for most of the software purchases; relating to revolving credit line balance, that free cash flow will meet expectations and that the Company will use free cash flow to pay down bank debt, buy back stock and fund dividends; relating to annual dividends, that the Board of Directors will continue to approve quarterly dividends and will vote to increase dividends over time; relating to diluted shares, that the Company will meet its cash flow expectations and that potential dilution created through the issuance of equity instruments will be mitigated by continued stock repurchases in accordance with the Company’s stock repurchase program. With respect to the provision of products or services outside our primary base of operations in the United States, all of the above factors apply, along with the difficulty of doing business in numerous sovereign jurisdictions due to differences in scale, competition, culture, laws and regulations. Other factors are detailed from time to time in our periodic reports and registration statements filed with the United States Securities and Exchange Commission. We believe that we have the product and technology offerings, facilities, associates and competitive and financial resources for continued business success, but future revenues, costs, margins and profits are all influenced by a number of factors, including those discussed above, all of which are inherently difficult to forecast. We undertake no obligation to update the information contained in this press release, including the Financial Road Map or any other forward-looking statement. Acxiom is a registered trademark of Acxiom Corporation.   ACXIOM CORPORATION AND SUBSIDIARIES CONSOLIDATED STATEMENTS OF OPERATIONS (Unaudited) (Dollars in thousands, except earnings per share)     For the Three Months Ended December 31, $ % 2006  2005  Variance Variance   Revenue: Services 265,798  263,266  2,532  1.0% Data 87,043  84,165  2,878  3.4% Total revenue 352,841  347,431  5,410  1.6%   Operating costs and expenses: Cost of revenue Services 199,704  189,502  10,202  5.4% Data 53,004  48,799  4,205  8.6% Total cost of revenue 252,708  238,301  14,407  6.0%   Services gross margin 24.9% 28.0% Data gross margin 39.1% 42.0% Total gross margin 28.4% 31.4%   Selling, general and administrative 49,065  57,625  (8,560) (14.9%) Gains, losses and other items, net (225) (1,202) 977  0.0%   Total operating costs and expenses 301,548  294,724  6,824  2.3%   Income from operations 51,293  52,707  (1,414) (2.7%)   Other income (expense): Interest expense (14,911) (8,635) (6,276) 72.7% Other, net 1,157  (71) 1,228  (1729.6%)   Total other income (expense) (13,754) (8,706) (5,048) 58.0%   Earnings before income taxes 37,539  44,001  (6,462) (14.7%)   Income taxes 12,594  16,720  (4,126) (24.7%)   Net earnings 24,945  27,281  (2,336) (8.6%)   Earnings per share:   Basic 0.32  0.32  0.00  0.0%   Diluted 0.31  0.31  0.00  0.0%   ACXIOM CORPORATION AND SUBSIDIARIES CONSOLIDATED STATEMENTS OF OPERATIONS (Unaudited) (Dollars in thousands, except earnings per share)     For the Nine Months Ended December 31, $ % 2006  2005  Variance Variance   Revenue: Services 793,789  754,958  38,831  5.1% Data 244,076  233,267  10,809  4.6% Total revenue 1,037,865  988,225  49,640  5.0%   Operating costs and expenses: Cost of revenue Services 597,161  575,734  21,427  3.7% Data 153,638  149,808  3,830  2.6% Total cost of revenue 750,799  725,542  25,257  3.5%   Services gross margin 24.8% 23.7% Data gross margin 37.1% 35.8% Total gross margin 27.7% 26.6%   Selling, general and administrative 157,818  166,227  (8,409) (5.1%) Gains, losses and other items, net (225) 9,960  (10,185) 0.0%   Total operating costs and expenses 908,392  901,729  6,663  0.7%   Income from operations 129,473  86,496  42,977  49.7%   Other income (expense): Interest expense (31,630) (21,213) (10,417) 49.1% Other, net 4,489  1,870  2,619  140.1%   Total other income (expense) (27,141) (19,343) (7,798) 40.3%   Earnings before income taxes 102,332  67,153  35,179  52.4%   Income taxes 37,863  26,084  11,779  45.2%   Net earnings 64,469  41,069  23,400  57.0%   Earnings per share:   Basic 0.77  0.47  0.30  63.8%   Diluted 0.75  0.45  0.30  66.7%   ACXIOM CORPORATION AND SUBSIDIARIES CONSOLIDATED STATEMENTS OF OPERATIONS (Unaudited) (Dollars in thousands, except earnings per share)     For the Three Months Ended   December 31, September 30, $ % 2006  2006  Variance Variance   Revenue: Services 265,798  266,099  (301) (0.1%) Data 87,043  82,220  4,823  5.9% Total revenue 352,841  348,319  4,522  1.3%   Operating costs and expenses: Cost of revenue Services 199,704  201,384  (1,680) (0.8%) Data 53,004  51,062  1,942  3.8% Total cost of revenue 252,708  252,446  262  0.1%   Services gross margin 24.9% 24.3% Data gross margin 39.1% 37.9% Total gross margin 28.4% 27.5%   Selling, general and administrative 49,065  54,008  (4,943) (9.2%) Gains, losses and other items, net (225) -  (225) 0.0%   Total operating costs and expenses 301,548  306,454  (4,906) (1.6%)   Income from operations 51,293  41,865  9,428  22.5%   Other income (expense): Interest expense (14,911) (8,950) (5,961) 66.6% Other, net 1,157  2,685  (1,528) (56.9%)   Total other income (expense) (13,754) (6,265) (7,489) 119.5%   Earnings before income taxes 37,539  35,600  1,939  5.4%   Income taxes 12,594  13,884  (1,290) (9.3%)   Net earnings 24,945  21,716  3,229  14.9%   Earnings per share:   Basic 0.32  0.25  0.07  28.0%   Diluted 0.31  0.25  0.06  24.0%   ACXIOM CORPORATION AND SUBSIDIARIES CALCULATION OF EARNINGS PER SHARE (Unaudited) (In thousands, except earnings per share)     For the Three Months Ended   December 31, December 31, September 30, 2006  2005  2006    Basic earnings per share:   Numerator - net earnings 24,945  27,281  21,716    Denominator - weighted-average shares outstanding 77,717  85,203  86,000    Basic earnings per share 0.32  0.32  0.25    Diluted earnings per share:   Numerator - net earnings   Net earnings 24,945  27,281  21,716    Denominator:   Weighted-average shares outstanding 77,717  85,203  86,000    Dilutive effect of common stock options, warrants and restricted stock 2,238  2,723  2,203    79,955  87,926  88,203    Diluted earnings per share 0.31  0.31  0.25    ACXIOM CORPORATION AND SUBSIDIARIES CALCULATION OF EARNINGS PER SHARE (Unaudited) (In thousands, except earnings per share)     For the Nine Months Ended December 31,   2006  2005    Basic earnings per share:   Numerator - net earnings 64,469  41,069    Denominator - weighted-average shares outstanding 83,957  87,748    Basic earnings per share 0.77  0.47    Diluted earnings per share:   Numerator - net earnings   Net earnings 64,469  41,069    Denominator:   Weighted-average shares outstanding 83,957  87,748    Dilutive effect of common stock options, warrants and restricted stock 2,237  2,691    86,194  90,439    Diluted earnings per share 0.75  0.45    ACXIOM CORPORATION AND SUBSIDIARIES RESULTS BY SEGMENT (Unaudited) (Dollars in thousands)     For the Three Months Ended   December 31, December 31, September 30, Revenue: 2006  2005  2006    US services & data 298,978  300,086  300,204  International services & data 53,863  47,345  48,115    Total revenue 352,841  347,431  348,319    US supplemental information: Services & data excluding IT mgmt 211,312  210,455  211,447  IT management services 87,666  89,631  88,757  298,978  300,086  300,204    International supplemental information: Services & data excluding IT mgmt 53,863  47,345  48,115      Income from operations:   US services & data 46,832  47,766  40,090  International services & data 4,236  3,739  1,775  Corporate & other 225  1,202  -    Total income from operations 51,293  52,707  41,865    Margin:   US services & data 15.7% 15.9% 13.4% International services & data 7.9% 7.9% 3.7%   Total margin 14.5% 15.2% 12.0%   ACXIOM CORPORATION AND SUBSIDIARIES RESULTS BY SEGMENT (Unaudited) (Dollars in thousands)     For the Nine Months Ended December 31,   Revenue: 2006  2005    US services & data 890,601  851,846  International services & data 147,264  136,379    Total revenue 1,037,865  988,225    US supplemental information: Services & data excluding IT mgmt 624,001  589,653  IT management services 266,600  262,193  890,601  851,846    International supplemental information: Services & data excluding IT mgmt 147,264  136,379      Income from operations:   US services & data 122,872  95,129  International services & data 6,376  1,327  Corporate & other 225  (9,960)   Total income from operations 129,473  86,496    Margin:   US services & data 13.8% 11.2% International services & data 4.3% 1.0%   Total margin 12.5% 8.8%   ACXIOM CORPORATION AND SUBSIDIARIES DATA REVENUE AND COST OF DATA SUPPLEMENTAL SCHEDULE (Unaudited) (Dollars in thousands)     For the Three Months Ended   December 31, December 31, $ % September 30, $ % 2006  2005  Variance Variance 2006  Variance Variance   Data 68,520  66,054  2,466  3.7% 62,654  5,866  9.4% Passthrough data 18,523  18,111  412  2.3% 19,566  (1,043) (5.3%)   Total data revenue 87,043  84,165  2,878  3.4% 82,220  4,823  5.9%     Cost of data revenue: Data 34,481  30,688  3,793  12.4% 31,496  2,985  9.5% Passthrough data 18,523  18,111  412  2.3% 19,566  (1,043) (5.3%)   Total cost of data 53,004  48,799  4,205  8.6% 51,062  1,942  3.8%   Margin:   Data 49.7% 53.5% 49.7% Passthrough data 0.0% 0.0% 0.0% Total data 39.1% 42.0% 37.9%   ACXIOM CORPORATION AND SUBSIDIARIES DATA REVENUE AND COST OF DATA SUPPLEMENTAL SCHEDULE (Unaudited) (Dollars in thousands)     For the Nine Months Ended December 31, $ % 2006  2005  Variance Variance   Data 185,704  177,454  8,250  4.6% Passthrough data 58,372  55,813  2,559  4.6%   Total data revenue 244,076  233,267  10,809  4.6%     Cost of data revenue: Data 95,266  93,995  1,271  1.4% Passthrough data 58,372  55,813  2,559  4.6%   Total cost of data 153,638  149,808  3,830  2.6%   Margin:   Data 48.7% 47.0% Passthrough data 0.0% 0.0% Total data 37.1% 35.8%   ACXIOM CORPORATION AND SUBSIDIARIES CONDENSED CONSOLIDATED BALANCE SHEETS (Unaudited) (Dollars in thousands)   December 31, March 31, $ % 2006  2006  Variance Variance Assets Current assets: Cash and cash equivalents 88,014  7,705  80,309  1042.3% Trade accounts receivable, net 276,061  261,624  14,437  5.5% Deferred income taxes 24,452  24,587  (135) (0.5%) Other current assets 53,437  44,937  8,500  18.9%   Total current assets 441,964  338,853  103,111  30.4%   Property and equipment 713,235  662,948  50,287  7.6% Less - accumulated depreciation and amortization 397,261  329,177  68,084  20.7%   Property and equipment, net 315,974  333,771  (17,797) (5.3%)   Software, net of accumulated amortization 40,319  45,509  (5,190) (11.4%) Goodwill 500,639  472,401  28,238  6.0% Purchased software licenses, net of accumulated amortization 149,982  155,518  (5,536) (3.6%) Unbilled and notes receivable, excluding current portions 17,466  19,139  (1,673) (8.7%) Deferred costs, net 130,016  112,817  17,199  15.2% Data acquisition costs 35,241  40,828  (5,587) (13.7%) Other assets, net 19,504  21,662  (2,158) (10.0%)   1,651,105  1,540,498  110,607  7.2%   Liabilities and Stockholders' Equity Current liabilities: Current installments of long-term obligations 100,801  93,518  7,283  7.8% Trade accounts payable 41,343  44,144  (2,801) (6.3%) Accrued payroll and related expenses 28,318  32,139  (3,821) (11.9%) Other accrued expenses 79,166  81,428  (2,262) (2.8%) Deferred revenue 99,606  123,916  (24,310) (19.6%) Income taxes 7,055  4,845  2,210  45.6%   Total current liabilities 356,289  379,990  (23,701) (6.2%)   Long-term obligations: Long-term debt and capital leases, net of current installments 688,381  353,692  334,689  94.6% Software and data licenses, net of current installments 20,353  22,723  (2,370) (10.4%)   Total long-term obligations 708,734  376,415  332,319  88.3%     Deferred income taxes 77,043  77,916  (873) (1.1%)   Commitments and contingencies   Stockholders' equity: Common stock 11,103  10,946  157  1.4% Additional paid-in capital 709,983  677,026  32,957  4.9% Unearned stock-based compensation -  (1,941) 1,941  (100.0%) Retained earnings 461,276  410,278  50,998  12.4% Accumulated other comprehensive income 15,670  2,205  13,465  610.7% Treasury stock, at cost (688,993) (392,337) (296,656) 75.6%   Total stockholders' equity 509,039  706,177  (197,138) (27.9%)   1,651,105  1,540,498  110,607  7.2%   ACXIOM CORPORATION AND SUBSIDIARIES CONDENSED CONSOLIDATED STATEMENTS OF CASH FLOWS (Unaudited) (Dollars in thousands)   For the Three Months Ended   December 31,       2006    2005    Cash flows from operating activities: Net earnings 24,945  27,281  Non-cash operating activities: Depreciation and amortization 54,396  59,712  Loss (gain) on disposal or impairment of assets, net 187  (524) Deferred income taxes (553) 4,386  Non-cash stock compensation expense 1,555  346  Changes in operating assets and liabilities: Accounts receivable (8,933) (8,552) Other assets (769) (6,587) Accounts payable and other liabilities 979  4,161  Deferred revenue (9,148) 15,191  Net cash provided by operating activities 62,659  95,414  Cash flows from investing activities: Disposition of operations -  3,315  Sale of assets -  1,510  Capitalized software (6,798) (5,204) Capital expenditures (2,518) (401) Cash collected from the sale and license of software -  20,000  Deferral of costs (16,149) (19,603) Payments received from investments -  2,093  Net cash paid in acquisitions (14,400) (2,983) Net cash used by investing activities (39,865) (1,273) Cash flows from financing activities: Proceeds from debt (513) 31,833  Payments of debt (25,817) (125,264) Dividends paid (4,663) (4,259) Sale of common stock 8,896  10,058  Acquisition of treasury stock (6,001) (2,430) Tax benefit of stock options exercised 1,237  -  Net cash used by financing activities (26,861) (90,062) Effect of exchange rate changes on cash 249  (135)   Net increase (decrease) in cash and cash equivalents (3,818) 3,944  Cash and cash equivalents at beginning of period 91,832  5,962  Cash and cash equivalents at end of period 88,014  9,906    Supplemental cash flow information: Cash paid (received) during the period for: Interest 14,813  7,932  Income taxes 8,196  1,070  Payments on capital leases and installment payment arrangements 16,700  17,994  Payments on software and data license liabilities 6,000  7,344  Other debt payments, excluding line of credit 3,117  1,715  Noncash investing and financing activities: Acquisition of property and equipment under capital lease and installment payment arrangements 10,427  14,804  Construction and other financing 4,511  402  Issuance of common stock for acquisition 3,610  -    ACXIOM CORPORATION AND SUBSIDIARIES CONDENSED CONSOLIDATED STATEMENTS OF CASH FLOWS (Unaudited) (Dollars in thousands)   For the Nine Months Ended   December 31,       2006    2005    Cash flows from operating activities: Net earnings 64,469  41,069  Non-cash operating activities: Depreciation and amortization 170,379  172,350  Gain on disposal or impairment of assets, net (1,483) (1,451) Deferred income taxes (975) 12,401  Non-cash stock compensation expense 2,699  968  Changes in operating assets and liabilities: Accounts receivable (15,768) (13,838) Other assets (2,159) (21,747) Accounts payable and other liabilities (7,844) 2,790  Deferred revenue (25,900) 9,133  Net cash provided by operating activities 183,418  201,675  Cash flows from investing activities: Disposition of operations -  4,844  Sale of assets -  5,123  Capitalized software (19,443) (16,686) Capital expenditures (5,995) (6,355) Cash collected from the sale and license of software 10,000  20,000  Deferral of costs (49,595) (54,498) Payments received from investments 2,708  2,855  Net cash paid in acquisitions (14,400) (144,509) Net cash used by investing activities (76,725) (189,226) Cash flows from financing activities: Proceeds from debt 649,756  423,122  Payments of debt (393,742) (216,041) Dividends paid (13,471) (13,068) Sale of common stock 25,801  31,609  Acquisition of treasury stock (299,301) (231,865) Tax benefit of stock options exercised 4,081  -  Net cash used by financing activities (26,876) (6,243) Effect of exchange rate changes on cash 492  (485)   Net increase in cash and cash equivalents 80,309  5,721  Cash and cash equivalents at beginning of period 7,705  4,185  Cash and cash equivalents at end of period 88,014  9,906    Supplemental cash flow information: Cash paid (received) during the period for: Interest 31,375  18,405  Income taxes 31,027  (376) Payments on capital leases and installment payment arrangements 57,556  53,890  Payments on software and data license liabilities 21,151  23,610  Other debt payments, excluding line of credit 6,632  5,506  Noncash investing and financing activities: Issuance of options for acquisition -  7,541  Software licenses and maintenance acquired under software obligation 15,266  8,380  Acquisition of property and equipment under capital lease and installment payment arrangements 44,454  70,377  Construction and other financing 18,167  7,200  Issuance of common stock for acquisition 3,610  -    ACXIOM CORPORATION AND SUBSIDIARIES CALCULATION OF FREE CASH FLOW AVAILABLE TO EQUITY AND RECONCILIATION TO OPERATING CASH FLOW (Unaudited) (Dollars in thousands)                   06/30/05  09/30/05  12/31/05  03/31/06  FY2006 06/30/06  09/30/06  12/31/06  YTD FY2007   Net cash provided by operating activities 61,476  44,785  95,414  74,158  275,833  56,350  64,409  62,659  183,418  Less: Tax benefit of stock options and warrants -  -  -  (19,097) (19,097) -  -  -  -    Subtotal 61,476  44,785  95,414  55,061  256,736  56,350  64,409  62,659  183,418    Plus: Proceeds received from the disposition of operations -  1,529  3,315  -  4,844  -  -  -  -  Proceeds received from the disposition of assets -  3,613  1,510  -  5,123  -  -  -  -  Payments received from investments 721  41  2,093  905  3,760  783  1,925  -  2,708  Less: Capitalized software (5,673) (5,809) (5,204) (5,217) (21,903) (5,719) (6,926) (6,798) (19,443) Capital expenditures (2,929) (3,025) (401) (493) (6,848) (217) (3,260) (2,518) (5,995) Deferral of costs (16,192) (18,703) (19,603) (15,956) (70,454) (16,887) (16,559) (16,149) (49,595) Payments on capital leases and installment payment arrangements (19,929) (15,967) (17,994) (18,342) (72,232) (18,905) (21,951) (16,700) (57,556) Payments on software and data license liabilities (10,938) (5,328) (7,344) (5,459) (29,069) (7,847) (7,304) (6,000) (21,151) Other required debt payments (1,357) (2,434) (1,715) (3,796) (9,302) (1,711) (1,804) (3,117) (6,632)   Subtotal 5,179  (1,298) 50,071  6,703  60,655  5,847  8,530  11,377  25,754    Plus: Tax benefit of stock options and warrants -  -  -  19,097  19,097  1,079  1,765  1,237  4,081    Subtotal 5,179  (1,298) 50,071  25,800  79,752  6,926  10,295  12,614  29,835    Plus: Cash collected from sale of software -  -  20,000  -  20,000  5,000  5,000  -  10,000    Total 5,179  (1,298) 70,071  25,800  99,752  11,926  15,295  12,614  39,835    ACXIOM CORPORATION AND SUBSIDIARIES CONSOLIDATED STATEMENTS OF OPERATIONS (Unaudited) (Dollars in thousands, except earnings per share)                   Q3 FY06 to Q3 FY07 Q2 FY07 to Q3 FY07 06/30/05  09/30/05  12/31/05  03/31/06  FY2006 06/30/06  09/30/06  12/31/06  % $ % $ Revenue: Services 238,499  253,193  263,266  257,591  1,012,549  261,892  266,099  265,798  1.0% 2,532  -0.1% (301) Data 71,772  77,330  84,165  86,752  320,019  74,813  82,220  87,043  3.4% 2,878  5.9% 4,823  Total revenue 310,271  330,523  347,431  344,343  1,332,568  336,705  348,319  352,841  1.6% 5,410  1.3% 4,522    Operating costs and expenses: Cost of revenue Services 194,349  191,883  189,502  196,428  772,162  196,073  201,384  199,704  5.4% 10,202  -0.8% (1,680) Data 48,885  52,124  48,799  52,142  201,950  49,572  51,062  53,004  8.6% 4,205  3.8% 1,942  Total cost of revenue 243,234  244,007  238,301  248,570  974,112  245,645  252,446  252,708  6.0% 14,407  0.1% 262      Selling, general and administrative 53,700  54,902  57,625  51,642  217,869  54,745  54,008  49,065  -14.9% (8,560) -9.2% (4,943) Gains, losses and other items, net (1,637) 12,799  (1,202) (456) 9,504  0  0  (225) -81.3% 977  0.0% (225)   Total operating costs and expenses 295,297  311,708  294,724  299,756  1,201,485  300,390  306,454  301,548  2.3% 6,824  -1.6% (4,906)   Income from operations 14,974  18,815  52,707  44,587  131,083  36,315  41,865  51,293  -2.7% (1,414) 22.5% 9,428  % Margin 4.8% 5.7% 15.2% 12.9% 9.8% 10.8% 12.0% 14.5% Other income (expense) Interest expense (5,162) (7,416) (8,635) (7,531) (28,744) (7,769) (8,950) (14,911) 72.7% (6,276) 66.6% (5,961) Other, net 891  1,050  (71) 135  2,005  647  2,685  1,157  -1729.6% 1,228  -56.9% (1,528) Total other income (expense) (4,271) (6,366) (8,706) (7,396) (26,739) (7,122) (6,265) (13,754) 58.0% (5,048) 119.5% (7,489)   Earnings before income taxes 10,703  12,449  44,001  37,191  104,344  29,193  35,600  37,539  -14.7% (6,462) 5.4% 1,939  Income taxes 4,064  5,300  16,720  14,132  40,216  11,385  13,884  12,594  -24.7% (4,126) -9.3% (1,290)   Net earnings 6,639  7,149  27,281  23,059  64,128  17,808  21,716  24,945  -8.6% (2,336) 14.9% 3,229      Diluted earnings (loss) per share 0.07  0.08  0.31  0.26  0.71  0.20  0.25  0.31  0.0% 0.00  24.0% 0.06    ACXIOM CORPORATION AND SUBSIDIARIES CONSOLIDATED STATEMENTS OF OPERATIONS - INTERNAL FORMAT (Unaudited) (Dollars in thousands, except earnings per share)                     Q3 FY06 to Q3 FY07 Q2 FY07 to Q3 FY07 06/30/05  09/30/05  12/31/05  03/31/06  FY2006 06/30/06  09/30/06  12/31/06  % $ % $   Revenue 310,271  330,523  347,431  344,343  1,332,568  336,705  348,319  352,841  1.6% 5,410  1.3% 4,522    Operating costs and expenses:   Salaries and benefits 126,264  127,325  129,888  132,579  516,056  135,917  139,557  139,724  7.6% 9,836  0.1% 167    Computer, communications and other equipment 77,647  76,250  73,614  71,730  299,241  73,119  72,685  71,132  -3.4% (2,482) -2.1% (1,553)   Data costs 41,831  44,752  42,021  44,593  173,197  43,372  44,196  43,761  4.1% 1,740  -1.0% (435)   Other operating costs and expenses 51,192  50,582  50,403  51,310  203,487  47,982  50,016  47,156  -6.4% (3,247) -5.7% (2,860)   Gains, losses and other items, net (1,637) 12,799  (1,202) (456) 9,504  -  -  (225) -81.3% 977  0.0% (225)   Total operating costs and expenses 295,297  311,708  294,724  299,756  1,201,485  300,390  306,454  301,548  2.3% 6,824  -1.6% (4,906)   Income (loss) from operations 14,974  18,815  52,707  44,587  131,083  36,315  41,865  51,293  -2.7% (1,414) 22.5% 9,428  Operating Margin 4.8% 5.7% 15.2% 12.9% 9.8% 10.8% 12.0% 14.5% Other income (expense): Interest expense (5,162) (7,416) (8,635) (7,531) (28,744) (7,769) (8,950) (14,911) 72.7% (6,276) 66.6% (5,961) Other, net 891  1,050  (71) 135  2,005  647  2,685  1,157  -1729.6% 1,228  -56.9% (1,528)   (4,271) (6,366) (8,706) (7,396) (26,739) (7,122) (6,265) (13,754) 58.0% (5,048) 119.5% (7,489)   Earnings (loss) before income taxes 10,703  12,449  44,001  37,191  104,344  29,193  35,600  37,539  -14.7% (6,462) 5.4% 1,939    Income taxes 4,064  5,300  16,720  14,132  40,216  11,385  13,884  12,594  -24.7% (4,126) -9.3% (1,290)   Net earnings (loss) 6,639  7,149  27,281  23,059  64,128  17,808  21,716  24,945  -8.6% (2,336) 14.9% 3,229    Diluted earnings (loss) per share 0.07  0.08  0.31  0.26  0.71  0.20  0.25  0.31  0.0% 0.00  24.0% 0.06    ACXIOM CORPORATION AND SUBSIDIARIES MARGIN ANALYSIS (Unaudited)                     Q3 FY06 to Q3 FY07 Q2 FY07 to Q3 FY07 06/30/05  09/30/05  12/31/05  03/31/06  FY2006 06/30/06  09/30/06  12/31/06  % $ % $   Gross profit 67,037  86,516  109,130  95,773  358,456  91,060  95,873  100,133  -8.2% (8,997) 4.4% 4,260  Gross margin 21.6% 26.2% 31.4% 27.8% 26.9% 27.0% 27.5% 28.4%   Operating margin 4.8% 5.7% 15.2% 12.9% 9.8% 10.8% 12.0% 14.5%   Services gross profit 44,150  61,310  73,764  61,163  240,387  65,819  64,715  66,094  -10.4% (7,670) 2.1% 1,379  Services gross margin 18.5% 24.2% 28.0% 23.7% 23.7% 25.1% 24.3% 24.9%   Data gross profit 22,887  25,206  35,366  34,610  118,069  25,241  31,158  34,039  -3.8% (1,327) 9.2% 2,881  Data gross margin 31.9% 32.6% 42.0% 39.9% 36.9% 33.7% 37.9% 39.1%   ACXIOM CORPORATION AND SUBSIDIARIES EXPENSE TREND ANALYSIS (Unaudited)                       06/30/05  09/30/05  12/31/05  03/31/06  FY2006 06/30/06  09/30/06  12/31/06  YTD FY2007   Salaries and benefits % of revenue 40.7% 38.5% 37.4% 38.5% 38.7% 40.4% 40.1% 39.6% 40.0%   Computer, communications and other equipment % of revenue 25.0% 23.1% 21.2% 20.8% 22.5% 21.7% 20.9% 20.2% 20.9%   Data costs % of revenue 13.5% 13.5% 12.1% 13.0% 13.0% 12.9% 12.7% 12.4% 12.7%   Other operating costs and expenses % of revenue 16.5% 15.3% 14.5% 14.9% 15.3% 14.3% 14.4% 13.4% 14.0%   Total operating costs and expenses % of revenue 95.2% 94.3% 84.8% 87.1% 90.2% 89.2% 88.0% 85.5% 87.5%   SG&A % of revenue 17.3% 16.6% 16.6% 15.0% 16.3% 16.3% 15.5% 13.9% 15.2%   ACXIOM CORPORATION   Financial Road Map (as of December 31, 2006)           Actual Actual Actual Target Long-Term Goals Years Ending March 31, Fiscal 2006 Q3 Fiscal 2007 YTD Fiscal 2007 Fiscal 2007 Fiscal 2010   U.S. Revenue Growth 13.6% -0.4% 4.5% 4% to 5% 8% to 11% (CAGR) U.S. Revenue $1,148 million $299 million $891 million $1,195 to $1,205 mil -    International Revenue Growth -13.0% 13.8% 8.0% 5% to 8% 5% to 8% (CAGR) International Revenue $185 million $54 million $147 million $195 to $200 mil -    U.S. Operating Margin 11.6% 15.7% 13.8% 13% to 14% 16% to 18% Adjusted U.S. Operating Margin 12.4%2   International Operating Margin -1.1% 7.9% 4.3% 4% to 5% 12% to 15% Adjusted International Operating Margin 2.5%2   Return on Assets 1 8.5% 10.9% 10.9% 10% to 11% 14% to 17% Adjusted Return on Assets 1 9.5%2   Return on Invested Capital 1 11.4%2 13.2% 13.2% 12% to 13% 16% to 19%   Operating Cash Flow $276 million $63 million $183 million $245 to $255 mil $320 to $360 mil   Free Cash Flow to Equity $100 million $13 million $40 million $50 to $60 mil $140 to $160 mil   Revolving Credit Line Balance $252 million $0 million $0 million < $250 mil < $250 mil   Dividends Per Share $0.20  $0.06  $0.16  $0.22  $0.24 to $0.28     1 ROA and ROIC are calculated on a trailing 4 quarters basis. 2 Results exclude unusual charges of $9.1 million for U.S. and $6.7 million for International in the quarter ended September 30, 2005. These charges are excluded when calculating performance compared to the Road Map since they were not considered in setting the Road Map target. All other time periods are as reported for GAAP.   Reconciliation of Non-GAAP Measurements (Dollars in thousands)                   Actual Actual Actual Target Long-Term Goals Years Ending March 31, Fiscal 2006 Q3 Fiscal 2007 YTD Fiscal 2007 Fiscal 2007 Fiscal 2010     U.S. Operating Margin   U.S. Revenue 1,147,641  298,978  890,601    U.S. Operating Income 133,072  47,057  123,097  U.S. Operating Income Margin 11.6% 15.7% 13.8%   Gains, losses and nonrecurring items, net 6,147  0  0  ValueAct Defense 2,216  0  0  Lawsuit Expenses 761  0  0  Adjusted U.S. Operating Income (1) 142,196  47,057  123,097  Adjusted U.S. Operating Income Margin (1) 12.4% 15.7% 13.8%   International Operating Margin   International Revenue 184,927  53,863  147,264    International Operating Income (1,991) 4,236  6,376  International Operating Income Margin -1.1% 7.9% 4.3%   Gains, losses and nonrecurring items, net 6,652  0  0  Adjusted International Operating Income (1) 4,661  4,236  6,376  Adjusted International Operating Income Margin (1) 2.5% 7.9% 4.3%                                           Free Cash Flow to Equity Low   High Low   High   Net cash provided by operating activities 275,833  62,659  183,418  245,000  255,000  320,000  360,000    Plus: Proceeds received from disposition of assets 5,123  0  0  0  0  0  0  Proceeds received from disposition of operations 4,844  0  0  0  0  0  0  Cash received from investments 3,760  0  2,708  3,000  3,000  0  0  Tax benefit of stock option and warrant exercise 0  1,237  4,081  5,000  5,000  10,000  10,000  Proceeds received from sale of software 20,000  0  10,000  10,000  10,000  0  0  33,727  1,237  16,789  18,000  18,000  10,000  10,000    Less: Capitalized software (21,903) (6,798) (19,443) (26,000) (26,000) (20,000) (25,000) Capital expenditures (6,848) (2,518) (5,995) (9,000) (9,000) (10,000) (10,000) Deferral of costs (70,454) (16,149) (49,595) (66,000) (66,000) (65,000) (75,000) Capital lease and installment payments (72,232) (16,700) (57,556) (75,000) (75,000) (65,000) (70,000) Software and data license liability payments (29,069) (6,000) (21,151) (27,000) (27,000) (25,000) (25,000) Other debt payments (9,302) (3,117) (6,632) (10,000) (10,000) (5,000) (5,000) (209,808) (51,282) (160,372) (213,000) (213,000) (190,000) (210,000)               Free cash flow to equity 99,752  12,614  39,835  50,000  to 60,000  140,000  to 160,000      Free cash flow to equity as defined by the Company may not be comparable to similarly titled measures reported by other companies. Management of the Company has included free cash flow to equity in this Financial Road Map representing the amount of money available for the Company's discretionary spending. Management believes that it provides investors with a useful alternative measure of liquidity by allowing an assessment of the amount of cash available for general corporate and strategic purposes after funding operating activities and capital expenditures, capitalized software expenses, deferred costs and required debt repayments. The above table reconciles free cash flow to equity to cash provided by operating activities, the nearest comparable GAAP measure.     Notes 1 Results exclude unusual charges of $9.1 million for U.S. and $6.7 million for International in the quarter ended September 30, 2005. These charges are excluded when calculating performance compared to the Road Map since they were not considered in setting the Road Map target. All other time periods are as reported for GAAP.   Reconciliation of Non-GAAP Measurements (Dollars in thousands)                                       Actual Actual Actual Target Long-Term Goals Fiscal 2006 Q3 Fiscal 2007 YTD Fiscal 2007 Fiscal 2007 Fiscal 2010                                         ROA ROIC ROA ROIC Return on Assets (ROA) and Return on Invested Capital (ROIC) ROA Adjusted ROA ROIC ROA ROIC ROA ROIC Low   High Low   High Low   High Low   High   Numerator: Income from operations (3) 131,083  131,083  131,083  174,060  174,060  174,060  174,060  163,200  178,700  163,200  178,700  268,600  337,600  268,600  337,600  Unusual Charges, Net (1) 15,776  15,776  0  0  0  0  0  0  0  0  Add implied interest on operating leases     11,696    10,369    10,369        10,400    10,400        9,000    9,000  131,083  146,859  158,554  174,060  184,429  174,060  184,429  163,200    178,700  173,600    189,100  268,600    337,600  277,600    346,600    Denominator: Average total assets 1,549,933  1,549,933  1,549,933  1,592,493  1,592,493  1,592,493  1,592,493  1,622,400  1,627,800  1,622,400  1,627,800  1,860,000  1,960,000  1,860,000  1,960,000  Less average cash (2) (8,616) (47,929) (47,929) (71,700) (74,200) (10,000) (10,000) Less average non-interest bearing current liabilities (288,063) (271,317) (271,317) (263,400) (266,400) (261,000) (285,000) Plus average present value of operating leases     135,190    128,525    128,525        128,600    128,600        114,000    114,000    1,549,933  1,549,933  1,388,444  1,592,493  1,401,773  1,592,493  1,401,773  1,622,400    1,627,800  1,415,900    1,415,800  1,860,000    1,960,000  1,703,000    1,779,000    Return on invested capital 8.5% 9.5% 11.4% 10.9% 13.2% 10.9% 13.2% 10% to 11% 12% to 13% 14% to 17% 16% to 19%   Notes 1. Results exclude unusual charges of $9.1 million for U.S. and $6.7 million for International in the quarter ended September 30, 2005. These charges are excluded when calculating performance compared to the Road Map since they were not considered in setting the Road Map target. All other time periods are as reported for GAAP. 2. Future cash balances above $10.0 million are assumed to be invested at money market rates and are excluded from this operating cash adjustment. 3. Trailing four quarters.     Return on Invested Capital (ROIC) as defined by the Company, may not be comparable to similarly titled measures reported by other companies. Management of the Company has included ROIC in this Financial Road Map because it measures the capital efficiency of our business. ROIC does not consider whether the business is financed with debt or equity; rather ROIC calculates a return on all capital invested in the business. The above table reconciles ROIC to a ROA calculation using GAAP numbers. The Company uses ROIC in a number of ways, including pricing analysis, capital expenditure evaluation, and merger and acquisition valuation.     General Road Map Definitions   1. Revenue Growth is defined as the percentage growth compared to the previous corresponding fiscal year or comparable period. 2. Operating Margin is defined as the income from operations as a percentage of revenue. 3. Operating Cash Flow is as shown on the Company's cash flow statement. 4. Free Cash Flow to Equity is defined as cash flow from operating activities plus or minus cash flow from investing activities (excluding net cash paid for acquisitions), less required payments of debt (total debt payments excluding payments on the line of credit). 5. Revolving Credit Line Balance is defined as actual funds borrowed under the Company’s revolving line of credit facility at the end of the period. 6. Dividends Per Share is defined as the sum of the dividends for that period. 7. Return on Assets (ROA) is defined as income from operations divided by average total assets for the trailing four quarters. 8. Return on Invested Capital (ROIC) is defined as trailing four quarters income from operations adjusted for the implied interest expense included in operating leases divided by the trailing four quarters' average invested capital. The implied interest adjustment for operating leases is calculated by multiplying the average quarterly balances of the present value of operating leases [(beginning balance + ending balance)/2] x an 8% implied interest rate on the leases. Average invested capital is defined as the trailing four-quarter average of the ending quarterly balances for total assets less operating cash, less non-interest bearing liabilities (current liabilities less the current portion of long-term debt), plus the present value of operating leases.

1 Year Acxiom Chart

1 Year Acxiom Chart

1 Month Acxiom Chart

1 Month Acxiom Chart

Your Recent History

Delayed Upgrade Clock