ADVFN Logo ADVFN

We could not find any results for:
Make sure your spelling is correct or try broadening your search.

Trending Now

Toplists

It looks like you aren't logged in.
Click the button below to log in and view your recent history.

Hot Features

Registration Strip Icon for charts Register for streaming realtime charts, analysis tools, and prices.

ACG Alliance Growers Corp

0.02
0.00 (0.00%)
18 Dec 2024 - Closed
Delayed by 15 minutes
Share Name Share Symbol Market Type
Alliance Growers Corp CSE:ACG CSE Common Stock
  Price Change % Change Share Price Bid Price Offer Price High Price Low Price Open Price Shares Traded Last Trade
  0.00 0.00% 0.02 0.01 0.01 0 00:00:00

AllianceBernstein Income Fund Releases Monthly Portfolio Update

22/04/2008 10:06pm

PR Newswire (US)


Alliance Growers (CSE:ACG)
Historical Stock Chart


From Dec 2019 to Dec 2024
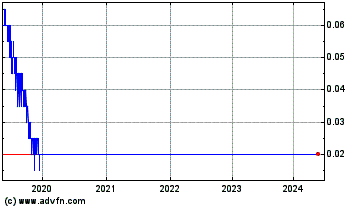
Click Here for more Alliance Growers Charts.
NEW YORK, April 22 /PRNewswire-FirstCall/ -- AllianceBernstein Income Fund, Inc. [NYSE: ACG] (the "Fund") today released its monthly portfolio update as of March 31, 2008. AllianceBernstein Income Fund, Inc. Top 10 Fixed-Income Holdings Portfolio% 1) US Treasury 11.25% (02/15/15) 8.00% 2) US Treasury Strip 0.00% (05/15/17) 5.79% 3) US Treasury Strip 0.00% (11/15/21) 4.92% 4) US Treasury 6.63% (02/15/27) 3.00% 5) US Treasury 4.00% (06/15/09) 2.91% 6) FNMA 30 Yr 5.50% (01/01/37) 2.79% 7) US Treasury 4.88% (05/15/09) 2.76% 8) Resolution Funding Corp 0.00% (10/15/20) 2.70% 9) US Treasury 12.00% (08/15/13) 2.67% 10) Fannie Mae 5.38% (06/12/17) 2.62% Security Type Breakdown Portfolio% Treasury 43.76% Sovereign 15.92% FHLMC 11.99% FNMA 9.22% CMO/ABS 3.12% Bank Loans 2.77% Inflation Indexed Bonds 1.64% GNMA 1.37% FHLB 0.82% Yankee Bonds 0.15% Preferred Stock 0.09% Government Agency 0.04% Warrants 0.03% GNMA/CMO 0.01% Corporate: Financial 2.39% Supranationals 0.84% Metals/Mining 0.71% Banking 0.59% Communications-Mobile 0.44% Cable 0.37% Industrial 0.34% Broadcasting/Media 0.27% Automotive 0.22% Communications 0.22% Retail 0.20% Air Transportation 0.17% Insurance 0.16% Energy 0.14% Healthcare 0.13% Public Utilities -- Gas 0.10% Chemicals 0.09% Food/Beverage 0.08% Petroleum Products 0.06% Communications-fixed 0.04% Hotel/Lodging 0.04% Agriculture 0.03% Building/Real Estate 0.03% Entertainment/Leisure 0.03% Non-air Transportation 0.03% Technology 0.03% Consumer Manufacturing 0.02% Containers 0.02% Public Utilities -- Elec & Gas 0.02% Electronics 0.01% Gaming 0.01% Public Utilities -- Telephone 0.01% Service 0.01% SUBTOTAL 7.85% Short-term: Other Short-term 1.22% SUBTOTAL 1.22% Total 100.00% Country Breakdown Portfolio% United States 81.22% Brazil 4.30% Turkey 2.13% Mexico 1.91% Hungary 1.53% United Kingdom 1.18% Philippines 0.86% South Africa 0.76% Indonesia 0.69% Argentina 0.67% Venezuela 0.59% Peru 0.57% Supranational 0.57% Colombia 0.45% Russia 0.33% Luxembourg 0.28% Ecuador 0.27% Bermuda 0.21% Panama 0.21% Cayman Islands 0.20% Uruguay 0.20% Australia 0.17% Canada 0.15% Malaysia 0.08% Austria 0.05% Dominican Republic 0.05% Ukraine 0.05% Germany 0.04% Lebanon 0.04% Netherlands 0.04% El Salvador 0.03% Ireland 0.03% Nigeria 0.03% Pakistan 0.02% Costa Rica 0.01% France 0.01% Greece 0.01% Jamaica 0.01% Japan 0.01% Jersey Ci 0.01% Poland 0.01% Spain 0.01% Sweden 0.01% Total 100.00% Credit Quality Breakdown Portfolio% AAA 72.74% AA 0.82% A 5.63% BBB 3.03% BB 9.85% B 4.44% CCC 1.42% A-1+ 2.04% NR 0.03% Total 100.00% Portfolio Statistics Percentage of Leverage: Bank Loans: 12.35% Investment Operations: 23.16% Preferred Stock: 0% Total: 35.51%(*) Avg. Maturity: 8.96 Years Duration: Corporate 6.25 yrs Emerging Market 5.41 yrs US Treasury 4.16 yrs High Yield 2.02 yrs Total Portfolio: 4.39 Years Total Net Assets: $2088.9 Million Net Asset Value: $8.61 Number of Holdings: 495 (*) The total percentage of leverage constitutes 12.35% in bank loans and 23.16% in investment operations, which may include the use of certain portfolio management techniques such as credit default swaps, dollar rolls, negative cash, reverse repurchase agreements and when-issued securities. The foregoing portfolio characteristics are as of the date indicated and can be expected to change. The Fund is a closed-end U.S.-registered management investment company advised by AllianceBernstein L. P. DATASOURCE: AllianceBernstein Income Fund, Inc. CONTACT: Shareholder Contact: +1-800-221-5672 Web site: http://www.alliancebernstein.com/

Copyright

1 Year Alliance Growers Chart

1 Year Alliance Growers Chart

1 Month Alliance Growers Chart

1 Month Alliance Growers Chart

Your Recent History

Delayed Upgrade Clock