ADVFN Logo ADVFN

We could not find any results for:
Make sure your spelling is correct or try broadening your search.

Trending Now

Toplists

It looks like you aren't logged in.
Click the button below to log in and view your recent history.

Hot Features

Registration Strip Icon for monitor Customisable watchlists with full streaming quotes from leading exchanges, such as LSE, NASDAQ, NYSE, AMEX, Bovespa, BIT and more.

LBY Libbey Inc

0.7957
0.00 (0.00%)
Last Updated: 00:00:00
Delayed by 15 minutes
Share Name Share Symbol Market Type
Libbey Inc AMEX:LBY AMEX Common Stock
  Price Change % Change Share Price High Price Low Price Open Price Shares Traded Last Trade
  0.00 0.00% 0.7957 0 00:00:00

Libbey Inc. Announces Estimated Fourth Quarter and Full Year 2009 Results

25/01/2010 11:31am

PR Newswire (US)


Libbey (AMEX:LBY)
Historical Stock Chart


From Jan 2020 to Jan 2025
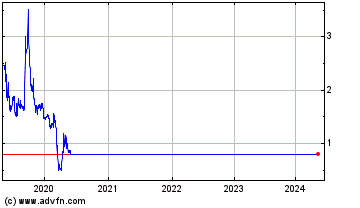
Click Here for more Libbey Charts.
- Fourth Quarter Net Sales Estimated at Approximately $207 million, an increase of Approximately 11 Percent versus the Prior-Year Quarter. - Sales to U.S. and Canadian Retail Customers Increase Approximately 17 Percent Compared to Prior-Year Quarter, Setting an All-Time Record for Any Quarter - Estimated Full-Year 2009 Sales of Approximately $748 Million TOLEDO, Ohio, Jan. 25 /PRNewswire-FirstCall/ -- Libbey Inc. (NYSE Amex: LBY) announced today select estimated financial results for the quarter and full year ended December 31, 2009. The preliminary estimates set forth below are based upon currently available information and are subject to completion of the Company's financial statements for these periods. The Company's actual results may differ significantly from these estimates. Preliminary estimates for the fourth quarter and full year 2009 are as follows: For the quarter ended December 31, 2009, the Company estimates: -- Total sales of approximately $207 million compared with $186.6 million for the prior-year quarter, representing an approximate increase of 11 percent. -- Primary contributors to the increased sales included an approximately 17 percent increase in sales to U.S. and Canadian retail customers compared to the prior-year quarter, which represents an all-time record for sales to these customers in any quarter in the Company's history. Sales to U.S. and Canadian foodservice customers increased approximately 6 percent, sales to Crisa customers increased approximately 15 percent and sales to International customers increased approximately 24 percent. -- Adjusted EBITDA of between $27 million and $29 million, compared with Adjusted EBITDA of $8.7 million in the fourth quarter of 2008. For the full year ended December 31, 2009, the Company estimates: -- Total sales of approximately $748 million compared with $810.2 million for the full year 2008. -- Adjusted EBITDA of between $88 million and $90 million, compared with Adjusted EBITDA of $85.2 million for the full year 2008. -- Record cash on hand of approximately $55 million at December 31, 2009, compared with $13.3 million at December 31, 2008. -- Availability of approximately $79 million under the Company's Asset Backed Loan (ABL) credit facility at December 31, 2009, compared with $44.6 million at December 31, 2008. Management presents Adjusted EBITDA, which is a non-GAAP liquidity measure, because it believes that Adjusted EBITDA is a useful tool for the Company and its investors to measure the Company's ability to meet debt service and capital expenditure and working capital requirements. Adjusted EBITDA, as presented, may not be comparable to similarly titled measures reported by other companies since not all companies necessarily calculate Adjusted EBITDA in an identical manner and therefore it is not necessarily an accurate means of comparison between companies. Adjusted EBITDA is not intended to represent cash flows for the period or funds available for management's discretionary use nor has it been represented as an alternative to operating income as an indicator of operating performance. Accordingly, Adjusted EBITDA should not be considered in isolation or as a substitute for measures of performance prepared in accordance with GAAP. In order to compensate for differences in the calculation of Adjusted EBITDA across companies, this measure should be evaluated in conjunction with GAAP measures such as operating income, net income, cash flow from operations and other measures of equal importance. In accordance with Regulation G under the Securities Exchange Act of 1934, the attached Table 1 is a reconciliation of (loss) income from operations to Adjusted EBITDA for the periods indicated. (Loss) income from operations is the most closely related GAAP measure to Adjusted EBITDA that is currently available. This press release includes forward-looking statements as defined in Section 27A of the Securities Act and Section 21E of the Securities Exchange Act of 1934, as amended. Such statements only reflect the Company's best assessment at this time and are indicated by words or phrases such as "goal," "expects," " believes," "will," "estimates," "anticipates," or similar phrases. Investors are cautioned that forward-looking statements involve risks and uncertainty, that actual results may differ materially from such statements, and that investors should not place undue reliance on such statements. These forward-looking statements may be affected by the risks and uncertainties in the Company's business. This information is qualified in its entirety by cautionary statements and risk factor disclosures contained in the Company's Securities and Exchange Commission filings, including the Company's report on Form 10-K filed with the Commission on March 16, 2009. Important factors potentially affecting performance include but are not limited to increased competition from foreign suppliers endeavoring to sell glass tableware in the United States and Mexico; the impact of lower duties for imported products; global economic conditions and the related impact on consumer spending levels; major slowdowns in the retail, travel or entertainment industries in the United States, Canada, Mexico, Western Europe and Asia, caused by terrorist attacks or otherwise; significant increases in per-unit costs for natural gas, electricity, corrugated packaging, and other purchased materials; higher indebtedness related to the Crisa acquisition; higher interest rates that increase the Company's borrowing costs or volatility in the financial markets that could constrain liquidity and credit availability; protracted work stoppages related to collective bargaining agreements; increases in expense associated with higher medical costs, increased pension expense associated with lower returns on pension investments and increased pension obligations; devaluations and other major currency fluctuations relative to the U.S. dollar and the Euro that could reduce the cost competitiveness of the Company's products compared to foreign competition; the effect of high inflation in Mexico and exchange rate changes to the value of the Mexican peso and the earnings and cash flow of Crisa, expressed under U.S. GAAP; the inability to achieve savings and profit improvements at targeted levels in the Company's operations or within the intended time periods; and whether the Company completes any significant acquisition and whether such acquisitions can operate profitably. Any forward-looking statements speak only as of the date of this press release, and the Company assumes no obligation to update or revise any forward-looking statement to reflect events or circumstances arising after the date of this press release. Libbey Inc.: -- is the largest manufacturer of glass tableware in the western hemisphere and one of the largest glass tableware manufacturers in the world; -- is expanding its international presence with facilities in China, Mexico, the Netherlands and Portugal; -- is the leading manufacturer of tabletop products for the U.S. foodservice industry; and -- supplies products to foodservice, retail, industrial and business-to-business customers in over 100 countries. Based in Toledo, Ohio, since 1888, Libbey operates glass tableware manufacturing plants in the United States in Louisiana and Ohio, as well as in Mexico, China, Portugal and the Netherlands. Its Crisa subsidiary, located in Monterrey, Mexico, is the leading producer of glass tableware in Mexico and Latin America. Its Royal Leerdam subsidiary, located in Leerdam, Netherlands, is among the world leaders in producing and selling glass stemware to retail, foodservice and industrial clients. Its Crisal subsidiary, located in Portugal, provides an expanded presence in Europe. Its Syracuse China subsidiary designs and distributes an extensive line of high-quality ceramic dinnerware, principally for foodservice establishments in the United States. Its World Tableware subsidiary imports and sells a full-line of metal flatware and hollowware and an assortment of ceramic dinnerware and other tabletop items principally for foodservice establishments in the United States. Its Traex subsidiary, located in Wisconsin, designs, manufactures and distributes an extensive line of plastic items for the foodservice industry. In 2008, Libbey Inc.'s net sales totaled $810.2 million. Table 1 Three Months Ended Year Ended December 31, December 31, 2008 2008 ------------- ------------- (Dollars in millions) (Loss) income from operations $(48.3) $(5.5) Add: Other income (expense) 0.8 1.1 Depreciation and amortization 11.0 44.4 Special charges (excluding depreciation also included in depreciation and amortization above) 45.2 45.2 ---- ---- Adjusted EBITDA(1) $8.7 $85.2 Expected Range for Expected Range for Three Months Ended Year Ended December 31, 2009 December 31, 2009 ------------- ----------------- (Dollars in millions) (Loss) income from operations $17.2 $19.2 $34.5 $36.5 Add: Other income (expense) (1.4) (1.4) 4.0 4.0 Depreciation and amortization 10.3 10.3 43.2 43.2 Special charges (excluding depreciation also included in depreciation and amortization above) 0.9 0.9 6.3 6.3 --- --- --- --- Adjusted EBITDA(1) $27.0 $29.0 $88.0 $90.0 (1) Adjusted EBITDA represents EBITDA (which is defined as (loss) income from operations plus (1) other income (expense) and (2) depreciation and amortization) adjusted to reflect special charges related to the impact of facility closures, goodwill and intangible asset impairment, fixed asset impairment and pension settlement charges. DATASOURCE: Libbey Inc. CONTACT: Kenneth Boerger, VP/Treasurer, +1-419-325-2279, or Greg Geswein, VP/Chief Financial Officer, +1-419-325-2451, both of Libbey Inc. Web Site: http://www.libbey.com/

Copyright

1 Year Libbey Chart

1 Year Libbey Chart

1 Month Libbey Chart

1 Month Libbey Chart

Your Recent History

Delayed Upgrade Clock