ADVFN Logo ADVFN

We could not find any results for:
Make sure your spelling is correct or try broadening your search.

Trending Now

Toplists

It looks like you aren't logged in.
Click the button below to log in and view your recent history.

Hot Features

Registration Strip Icon for default Register for Free to get streaming real-time quotes, interactive charts, live options flow, and more.

CQP Cheniere Energy Partners LP

51.88
0.00 (0.00%)
Pre Market
Last Updated: 01:00:00
Delayed by 15 minutes
Name Symbol Market Type
Cheniere Energy Partners LP AMEX:CQP AMEX Trust
  Price Change % Change Price High Price Low Price Open Price Traded Last Trade
  0.00 0.00% 51.88 0 01:00:00

Cheniere Energy Partners Reports Third Quarter 2009 Results

06/11/2009 1:00pm

PR Newswire (US)


Cheniere Energy Partners (AMEX:CQP)
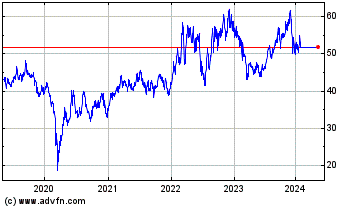
Historical Stock Chart


From Jul 2019 to Jul 2024

Click Here for more Cheniere Energy Partners Charts.
- Sabine Pass LNG receiving terminal fully operational - Estimated annualized distribution is $1.70 HOUSTON, Nov. 6 /PRNewswire-FirstCall/ -- For the quarter and nine months ended September 30, 2009, Cheniere Energy Partners, L.P. ("Cheniere Partners") (NYSE Amex: CQP) reported net income of $69.5 million and $125.0 million, or $0.43 and $0.77 per limited partner unit, respectively, compared with a net loss $10.9 million and $49.9 million, or ($ 0.07) and ($ 0.31) per limited partner unit, respectively, for the same periods in 2008. As of September 30, 2009, construction of the Sabine Pass LNG receiving terminal was substantially complete and fully operational with sendout capacity of 4.0 Bcf/d and storage capacity of 16.9 Bcfe. Results from operations From operations, Cheniere Partners reported income of $106.4 million and $224.0 million, respectively, for the quarter and nine months ended September 30, 2009 compared to a loss of $10.0 million and $16.9 million, respectively, for the same 2008 periods. Revenues for the quarter and nine months ended September 30, 2009 were $128.5 million and $286.8 million, respectively. Revenues primarily include capacity payments received from customers in accordance with their terminal use agreements ("TUAs"). The Cheniere Marketing, LLC TUA became effective in October 2008, the Total Gas and Power North America, Inc. TUA became effective April 1, 2009 and the Chevron U.S.A., Inc. TUA became effective July 1, 2009. Total operating expenses for the quarter and nine months ended September 30, 2009 were $22.2 million and $62.7 million, respectively, compared to $10.0 million and $16.9 million for the comparable 2008 periods. LNG receiving terminal operating expenses were $7.6 million and $22.8 million, respectively, for the quarter and nine months ended September 30, 2009 compared to $3.7 million and $3.9 million for the comparable 2008 periods. Depreciation and amortization expenses were $8.9 million and $22.7 million, respectively, for the quarter and nine months ended September 30, 2009 compared to $1.9 million and $1.9 million for the comparable 2008 periods. These costs increased in both periods primarily due to the commencement of operations at the terminal in the second half of 2008. General and administrative expenses for the quarter and nine months ended September 30, 2009 were $5.7 million and $17.2 million, respectively, compared to $4.1 million and $8.6 million in the comparable 2008 periods. General and administrative expenses increased for the nine months ended September 30, 2009 due to the commencement of a services agreement with a subsidiary of Cheniere Energy, Inc. on January 1, 2009. Interest expense for the quarter and nine months ended September 30, 2009 was $38.1 million and $104.4 million, respectively, compared to $17.7 million and $47.6 million, respectively, for the same 2008 periods. The increase in both periods was primarily due to less interest expense subject to capitalization during 2009. Interest income decreased $2.1 million for the third quarter 2009 and decreased $11.3 million for the nine months ended September 30, 2009 compared to the 2008 periods due to lower interest rates in 2009 and a lower average cash balance. In addition, the third quarter of 2009 included a $1.2 million gain on derivative instruments compared to a gain of $14.7 million for the third quarter of 2008 due to changes in natural gas commodity prices associated with hedges on LNG inventory. Cash and Cash Equivalents As of September 30, 2009, the Sabine Pass LNG receiving terminal was receiving capacity reservation fee payments from all three of its TUA customers. At September 30, 2009, Cheniere Partners had cash and cash equivalents of $121.6 million. These unrestricted funds are available for remaining construction expenditures, working capital and general purposes, including distributions to unit holders. Construction at the Sabine Pass LNG receiving terminal was substantially complete as of the end of the third quarter 2009 and the terminal is now fully operational with sendout capacity of 4.0 Bcf/d and storage capacity of 16.9 Bcfe. Our estimated aggregate construction, commissioning and operating cost budget through achievement of full operability is approximately $1.559 billion, excluding financing costs. These costs are anticipated to be funded with available cash held by Sabine Pass LNG, L.P. ("Sabine Pass"). At September 30, 2009, Cheniere Partners had restricted cash and cash equivalents of $137.3 million, including approximately $82.4 million in a permanent debt service reserve fund and $54.9 million for four months of interest as required in the Sabine Pass senior notes indenture. Unit Distributions Cheniere Partners estimates that its annualized distributions to unit holders will be $1.70 per unit. Distributions for the third quarter of 2009 of $0.425 per unit will be paid to all unit holders on November 13, 2009. Cheniere Partners owns 100 percent of the Sabine Pass LNG receiving terminal located in western Cameron Parish, Louisiana on the Sabine Pass Channel. Construction is substantially complete and the terminal is now operating with sendout capacity of 4.0 Bcf/d and storage capacity of 16.9 Bcfe. Additional information about Cheniere Energy Partners, L.P. may be found on its website: http://www.cheniereenergypartners.com/. This press release contains certain statements that may include "forward-looking statements" within the meanings of Section 27A of the Securities Act of 1933 and Section 21E of the Securities Exchange Act of 1934. All statements, other than statements of historical facts, included herein are "forward-looking statements." Included among "forward-looking statements" are, among other things, (i) statements regarding Cheniere Energy Partners' business strategy, plans and objectives and (ii) statements expressing beliefs and expectations regarding the development of Cheniere Energy Partners' LNG receiving terminal business. Although Cheniere Energy Partners believes that the expectations reflected in these forward-looking statements are reasonable, they do involve assumptions, risks and uncertainties, and these expectations may prove to be incorrect. Cheniere Energy Partners' actual results could differ materially from those anticipated in these forward-looking statements as a result of a variety of factors, including those discussed in Cheniere Energy Partners' periodic reports that are filed with and available from the Securities and Exchange Commission. You should not place undue reliance on these forward-looking statements, which speak only as of the date of this press release. Other than as required under the securities laws, Cheniere Energy Partners does not assume a duty to update these forward-looking statements. (Financial Table Follows) Cheniere Energy Partners, L.P. Selected Financial Information (in thousands, except per unit data) (1) Three Months Ended Nine Months Ended September 30, September 30, ---------------------- ---------------------- 2009 (2) 2008 (2) 2009 (2) 2008 (2) -------- -------- -------- -------- Revenues (4) $128,533 $- $286,777 - Operating costs and expenses LNG receiving terminal development expense (4) - 364 - 2,520 LNG receiving terminal operating expense (4) 7,562 3,703 22,838 3,881 Depreciation, depletion and amortization 8,905 1,874 22,711 1,911 General and administrative expense (4) 5,699 4,085 17,182 8,562 ----- ----- ------ ----- Total operating costs and expenses 22,166 10,026 62,731 16,874 ------ ------ ------ ------ Income (loss) from operations 106,367 (10,026) 224,046 (16,874) Interest expense, net (4) (38,089) (17,737) (104,383) (47,629) Interest income 65 2,169 883 12,218 Derivative gain 1,158 14,692 4,482 2,325 Other - 5 12 35 --- --- -- -- Net Income (loss) $69,501 $(10,897) $125,040 $(49,925) ======= ======== ======== ======== Allocation of net income (loss) to Partners: Limited Partners' Interest 68,111 (10,679) 122,539 (48,927) General Partner's Interest 1,390 (218) 2,501 (998) ----- ---- ----- ---- Net Income (loss) to Partners $69,501 $(10,897) $125,040 $(49,925) ======= ======== ======== ======== Basic and diluted net income (loss) per limited partner unit $0.43 $(0.07) $0.77 $(0.31) ===== ====== ===== ====== Weighted average limited partners units outstanding used for basic and diluted net income (loss) per unit calculation: Common units 26,416 26,416 26,416 26,416 Subordinated units 135,384 135,384 135,384 135,384 September 30, December 31, 2009 (3) 2008 (3) ------------- ------------ (Unaudited) Cash and cash equivalents $121,613 $7 Restricted cash and cash equivalents 54,929 235,985 Advances to Affiliate - LNG Inventory 3,490 - Other current assets (4) 15,145 10,111 Non-current restricted cash, cash equivalents and treasury securities 82,394 158,813 Property, plant and equipment, net 1,605,079 1,517,507 Debt issuance costs, net 27,907 30,748 Advances under long-term contracts 728 10,705 Advances to Affiliate - LNG Held for Commissioning (4) - 9,923 Other assets 7,665 5,036 ----- ----- Total assets $1,918,950 $1,978,835 ========== ========== Current liabilities (4) $166,934 $107,003 Long-term debt, net of discount 2,181,855 2,107,673 Long-term debt - Related party 70,661 Deferred revenue, including affiliate 41,860 42,471 Other liabilities (4) 331 2,712 Total partner's deficit (472,030) (351,685) -------- -------- Total liabilities and partners' deficit $1,918,950 $1,978,835 ========== ========== (1) Please refer to Cheniere Energy Partners, L.P. Quarterly Report on Form 10-Q for the period ended September 30, 2009, filed with the Securities and Exchange Commission. (2) Consolidated operating results of Cheniere Energy Partners, L.P. and its consolidated subsidiaries for the three and nine months ended September 30, 2009 and 2008. (3) Consolidated balance sheets of Cheniere Energy Partners, L.P. and its consolidated subsidiaries. (4) Amounts include transactions between Cheniere Partners and Cheniere Energy, Inc. or subsidiaries of Cheniere Energy, Inc. DATASOURCE: Cheniere Energy Partners, L.P. CONTACT: Investors, Christina Cavarretta, +1-713-375-5100, or Media, Diane Haggard, +1-713-375-5259, both of Cheniere Energy Partners, L.P. Web Site: http://www.cheniereenergypartners.com/

Copyright

1 Year Cheniere Energy Partners Chart

1 Year Cheniere Energy Partners Chart

1 Month Cheniere Energy Partners Chart

1 Month Cheniere Energy Partners Chart

Your Recent History

Delayed Upgrade Clock